. 2009 Nov 13;139(4):707-18.
doi: 10.1016/j.cell.2009.10.025.

Nonoptimal microbial response to antibiotics underlies suppressive drug interactions

Affiliations

Nonoptimal microbial response to antibiotics underlies suppressive drug interactions

Tobias Bollenbach et al. Cell. .

Abstract

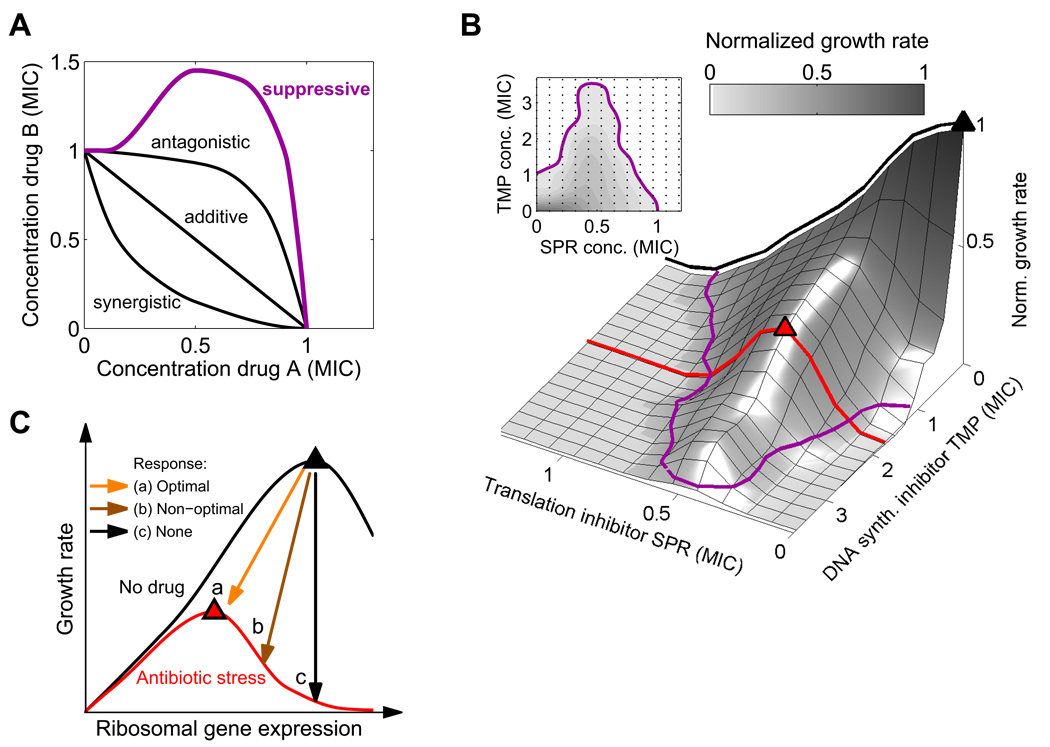
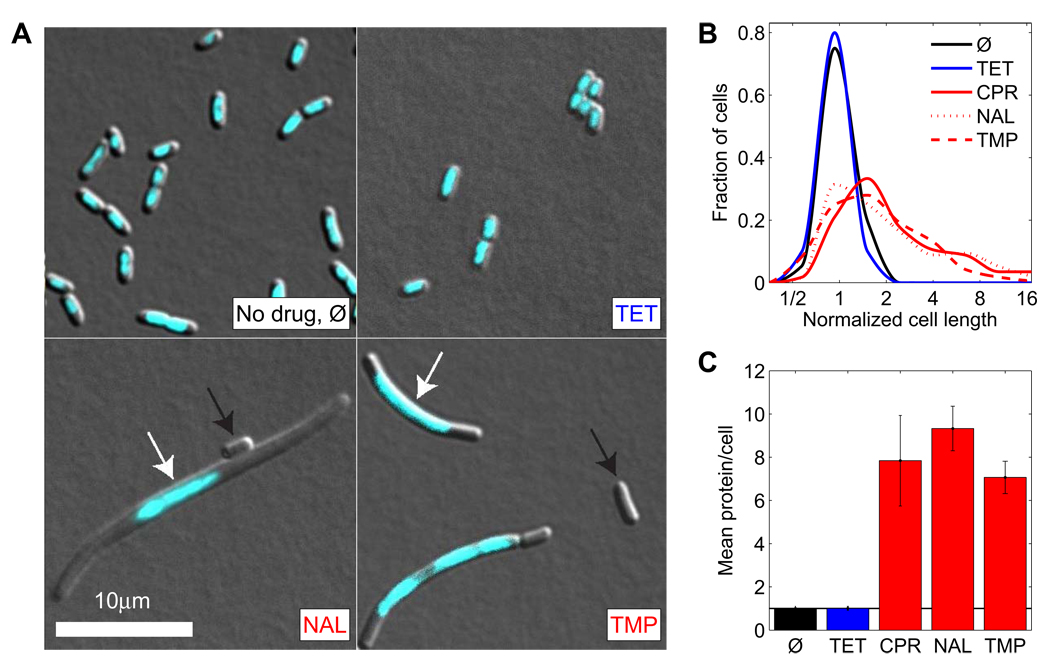
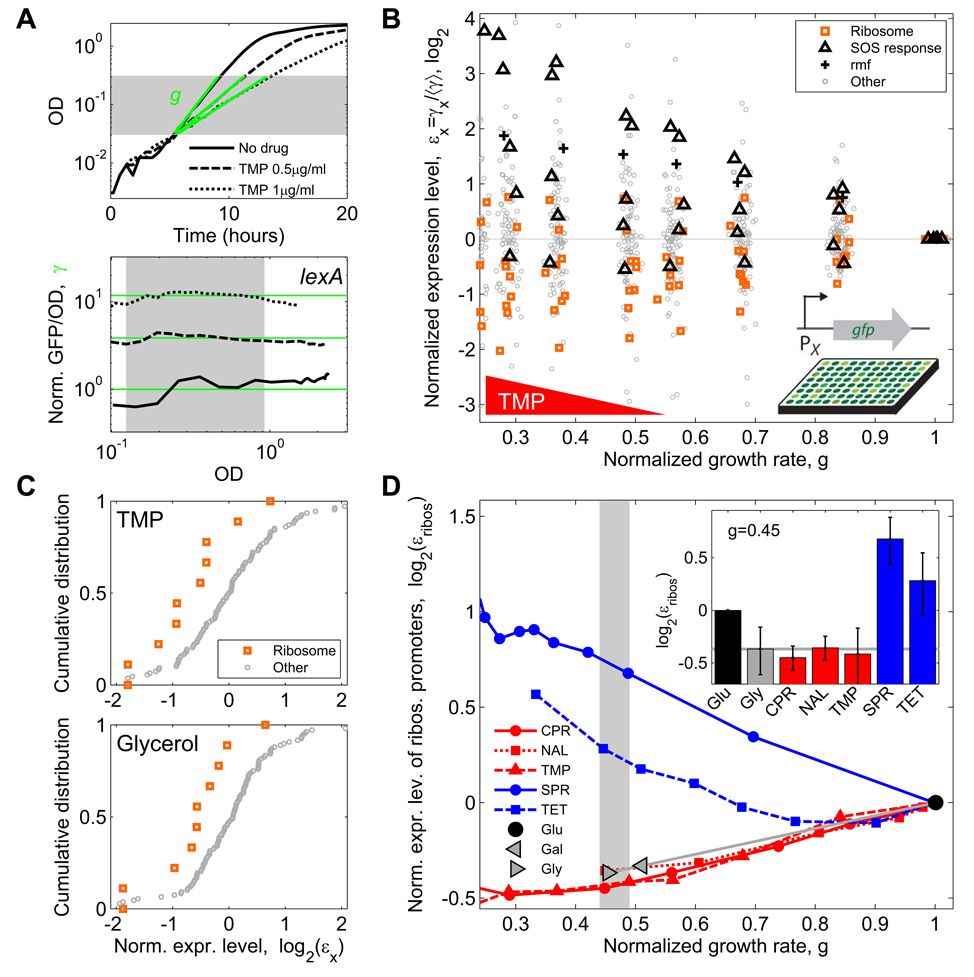
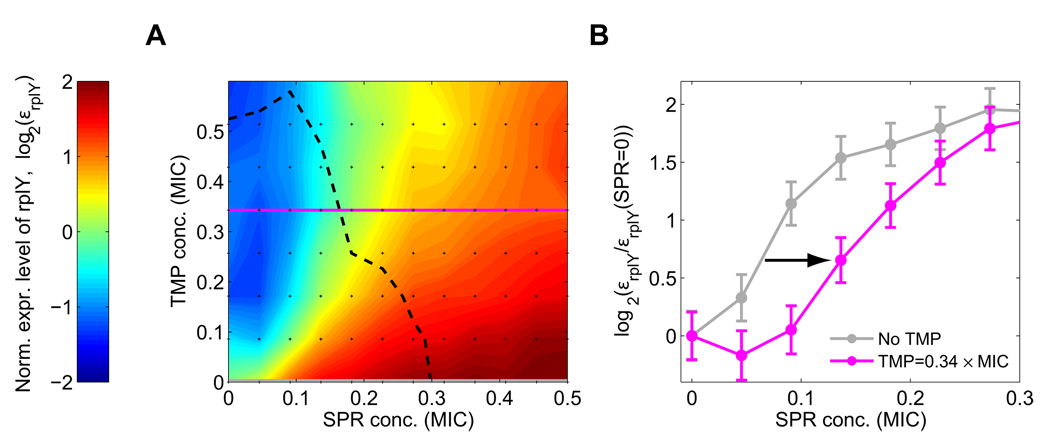
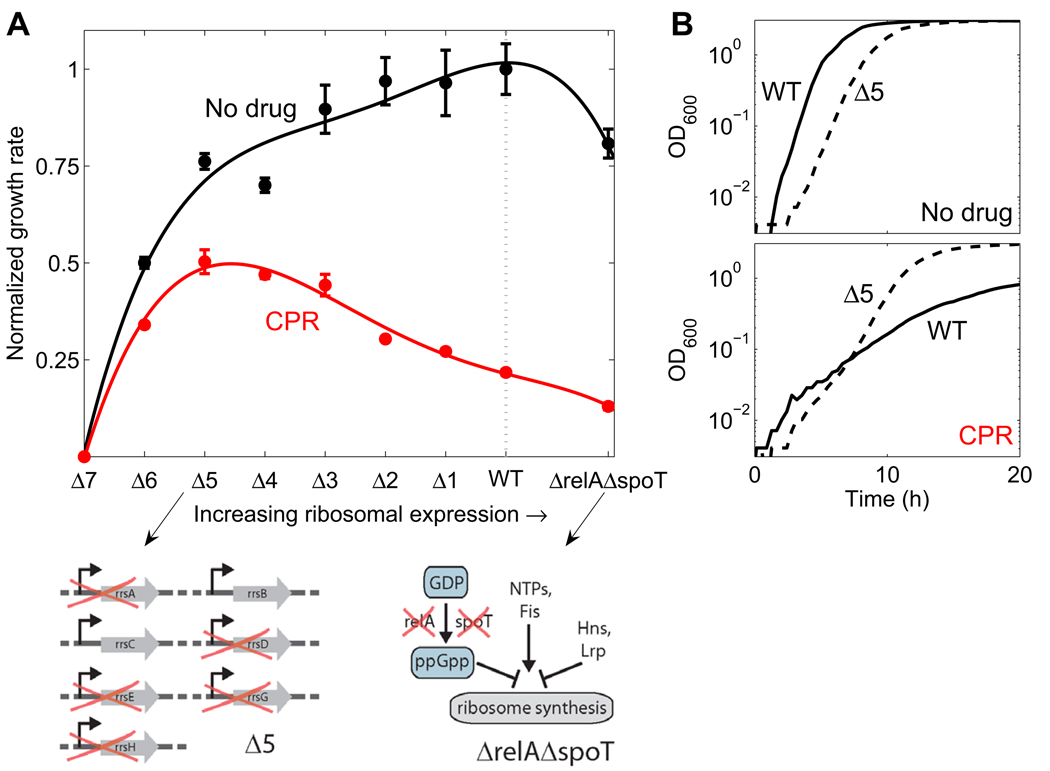
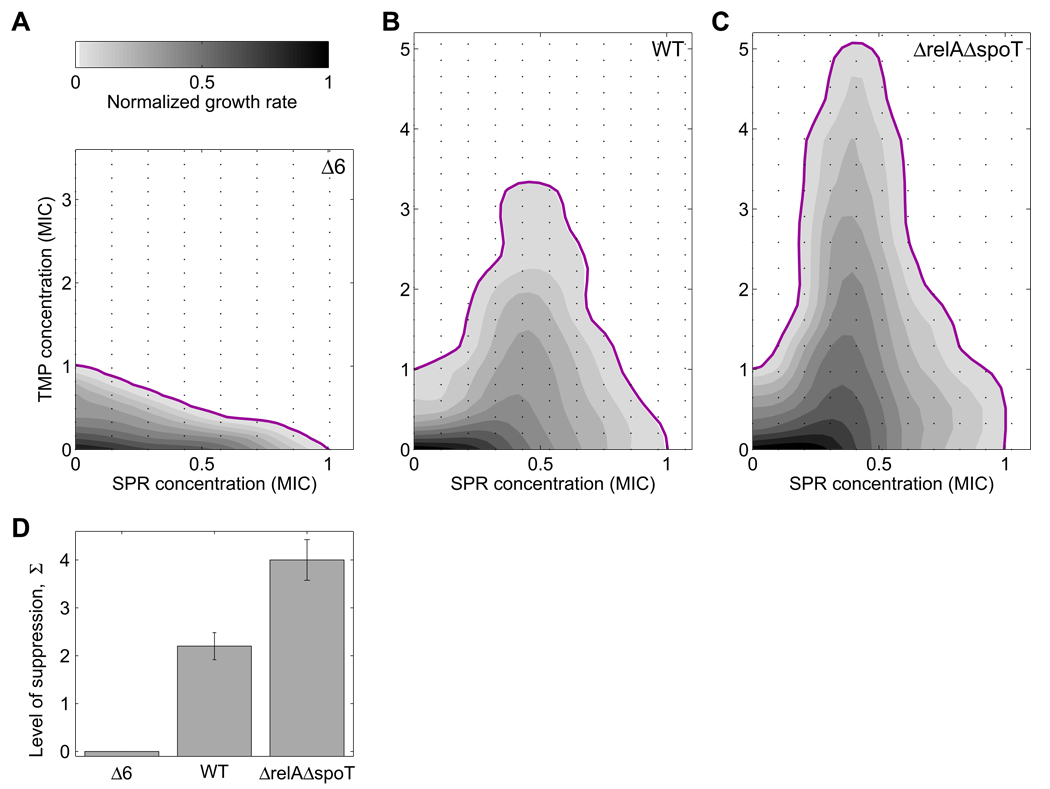
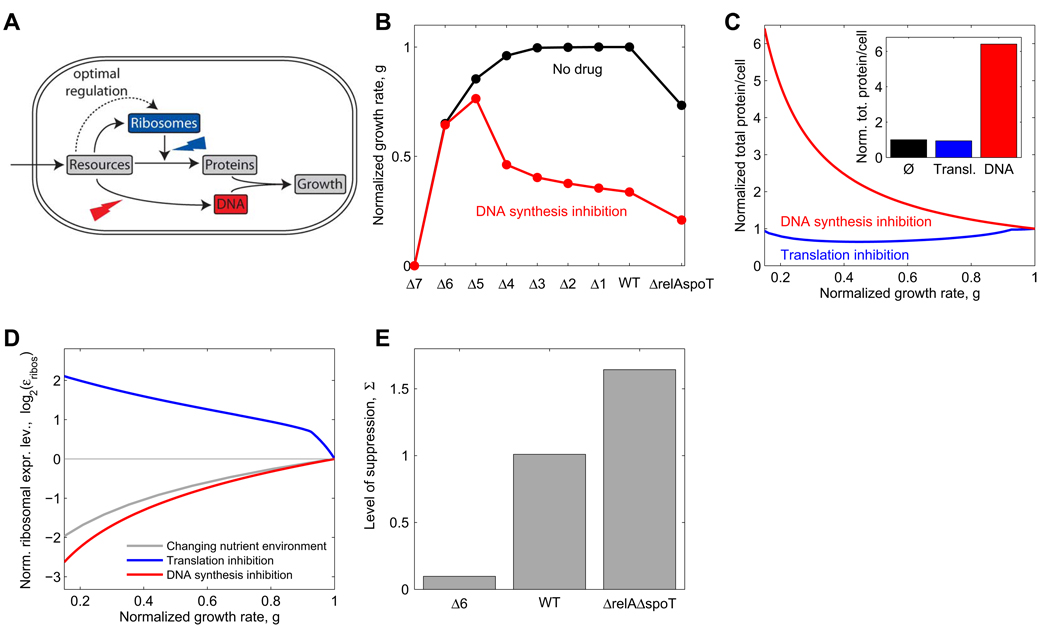
Suppressive drug interactions, in which one antibiotic can actually help bacterial cells to grow faster in the presence of another, occur between protein and DNA synthesis inhibitors. Here, we show that this suppression results from nonoptimal regulation of ribosomal genes in the presence of DNA stress. Using GFP-tagged transcription reporters in Escherichia coli, we find that ribosomal genes are not directly regulated by DNA stress, leading to an imbalance between cellular DNA and protein content. To test whether ribosomal gene expression under DNA stress is nonoptimal for growth rate, we sequentially deleted up to six of the seven ribosomal RNA operons. These synthetic manipulations of ribosomal gene expression correct the protein-DNA imbalance, lead to improved survival and growth, and completely remove the suppressive drug interaction. A simple mathematical model explains the nonoptimal regulation in different nutrient environments. These results reveal the genetic mechanism underlying an important class of suppressive drug interactions.


Figures

Figure 1
Figure 1. Suppression of DNA synthesis inhibitors by translation inhibitors suggests the hypothesis that ribosomal genes are not optimally regulated under DNA stress
(A) MIC lines (isoboles) in the two-dimensional concentration space of two drugs. Two drugs are defined to interact additively if their combined effect is constant along linear lines of fixed total dosage (Loewe, 1928). Synergy and antagonism are defined as negative or positive deviations from this null line. A particularly strong type of antagonism – ‘suppression’ – characterizes drug pairs whose combined effect is weaker than that of one of the drugs alone (magenta line). (B) Suppressive interaction is seen in measurements of growth rates (gray levels) and MIC line (magenta) in a two-dimensional gradient of the translation inhibitor spiramycin (SPR) and the DNA synthesis inhibitor trimethoprim (TMP, inhibitor of DNA synthesis through folic acid deficiency). In the absence of DNA synthesis inhibitor (black line), growth rate is maximal without translation inhibition (black triangle) and reduces monotonically with the level of translation inhibitor. In contrast, at fixed finite concentration of DNA synthesis inhibitor (red line), growth rate increases initially as the translation inhibitor concentration increases, reaching an optimal value (red triangle) at intermediate translation inhibition level. (C) Schematic expectation for growth rate as a function of ribosomal gene expression in absence (black line) or presence (red line) of an antibiotic. Arrows show possible ribosomal gene expression regulation in response to antibiotic addition. The comparison of panels B and C suggests the hypothesis that a non-optimal, too high ribosome level in response to DNA synthesis inhibitors may cause this suppressive drug interaction. MICs for antibiotics are summarized in Table 1.
Figure 2
Figure 2. DNA synthesis inhibitors lead to increased cell size and protein-DNA ratio
(A) Microscopy images of DAPI stained (cyan) E. coli cells growing in absence of antibiotics (Ø) and in presence of translation inhibitor TET and DNA synthesis inhibitors NAL and TMP. Scale bar, 10µm. DNA synthesis inhibitors lead to a mixed population of cells that are larger and contain only one or few nucleoids (white arrows). A small fraction of cells has no nucleoid (black arrows). (B) Histograms of cell lengths. Mean cell size and variability increases in presence of DNA synthesis inhibitors but not in presence of translation inhibitors. (C) Mean total protein per cell (measured by a variant of the Lowry assay) in presence of different antibiotics normalized to no drug control. All antibiotic concentrations are tuned to achieve the same normalized growth rate (~0.35). See Experimental Procedures.
Figure 3
Figure 3. Ribosomal gene expression is down-regulated under DNA stress only as much as in the normal physiological response to slow growth
(A) Example data demonstrating measurement of drug effect on growth rate and transcription reporters. Optical Density (OD) and GFP expression from various promoters (shown, as an example, is the promoter of lexA – the master regulator of the SOS response) are measured as a function of time for various drug concentrations (shown, 0, 0.5 and 1 µg/ml TMP). Top: growth rates are defined by linear regression (green lines) to the OD curves (black). Bottom: Expression level γ (green lines) is defined as GFP fluorescence intensity per OD, averaged over an OD range of exponential growth (shaded region) and normalized to no drug control. (B) Normalized expression levels εx of 110 promoters in E. coli as a function of growth rate in various concentrations of TMP. For each promoter x, εx is defined as expression level γx, normalized to the median expression level of all promoters 〈γ〉 (Experimental Procedures). SOS response promoters are up-regulated (black triangles). Most ribosomal promoters are down-regulated (orange squares) consistent with the up-regulation of the ribosome inactivator rmf (black crosses). Random scatter added to growth rate to enhance visibility. (C) Top: Cumulative distributions of normalized expression levels εx showing down-regulation of ribosomal genes (orange) relative to all other promoters (gray) at a fixed concentration of TMP (normalized growth rate ~0.49). Bottom: a similar regulation is seen with no drug when the same change in growth rate is achieved by changing the carbon source from glucose to glycerol. (D) Mean normalized expression level of ribosomal promoters εribos as a function of normalized growth rate for different DNA synthesis inhibitors (CPR, NAL, TMP; red), translation inhibitors (SPR, TET; blue), and in growth media with different carbon sources (glucose, galactose, glycerol; gray). Inset: εribos values at normalized growth rate of ~0.45; error bars show SEM. Ribosomal promoters are up-regulated in response to translation inhibitors and down-regulated in presence of DNA synthesis inhibitors. This down-regulation, however, is similar to the growth-rate dependent down-regulation that results from a change of carbon source (gray horizontal line).
Figure 4
Figure 4. Up-regulation of ribosomal promoters by protein synthesis inhibitors is delayed under DNA stress
(A) Color map of normalized expression level εrplY of ribosomal promoter rplY in a two-dimensional concentration matrix (black dots) of DNA synthesis inhibitor (TMP) and translation inhibitor (SPR). Other ribosomal promoters behave similarly, Figure S3. Dashed line, line of constant growth rate (isobole; g=0.38). (B) Relative change in expression level εrplY(SPR) / εrplY(SPR=0) as a function of SPR concentration, at no TMP (TMP=0, grey), and at a fixed TMP concentration (TMP=0.34 MIC, magenta). Up-regulation requires higher SPR concentration in the presence of TMP (arrow). Error-bars in B were estimated from the standard deviation of replicate measurements done on different days (see Figure S17).
Figure 5
Figure 5. Wild-type regulation of ribosomal expression level under DNA stress is non-optimal: genetically manipulating ribosome synthesis can increase survival and growth
(A) Normalized growth rates of wild-type (WT) and strains with incremental deletions of one to six of the seven rrn operons as well as for ΔrelA ΔspoT strain, in rich medium (LB) in the absence (black) and presence of the DNA synthesis inhibitor CPR (red). Lines, 4th order polynomial fit to guide the eye. Schematic on left: strain Δ5 in which 5 of 7 rrn operons are deleted. Schematic on right: ΔrelA ΔspoT strain which is devoid of ppGpp, a key negative regulator of ribosome synthesis, while other factors regulating ribosome synthesis remain. While wild-type expression level is optimized for maximal growth under no drug conditions, it is not optimized for maximal growth under DNA synthesis inhibition: Reduced ribosome synthesis in rrn deletion strains increases growth. (B) Sample data showing the growth curves (OD versus time) for WT (solid line) and Δ5 strain (dashed line) in no drug or under CPR at the concentration of A.
Figure 6
Figure 6. Genetically optimizing ribosome synthesis removes suppressive drug interaction between inhibitors of DNA synthesis and translation
Growth rates (gray levels) and MIC line (magenta) of Δ6 (A), WT (B), and ΔrelA ΔspoT strain (C) in two-dimensional concentration matrices (black dots) of DNA synthesis inhibitor (TMP) and translation inhibitor (SPR). The suppressive drug interaction (B) disappears when ribosome synthesis is reduced (A) and is amplified when down-regulation of ribosome synthesis is impaired (C). The disappearance of suppression is incremental with number of rrn deletions and does not depend on the specific DNA synthesis or translation inhibitor used, Figure S1. (D) Quantified level of suppression in the three strains. The level of suppression Σ is defined as Σ=(MICmax − MIC0)/ MIC0, where MICmax is the maximal TMP MIC over all SPR concentrations and MIC0 the TMP MIC in absence of SPR. Cultures grown in rich medium (LB).
Figure 7
Figure 7. Mathematical model with optimal growth rate-dependent regulation of ribosome synthesis yields non-optimal response to DNA synthesis and thereby suppression by translation inhibitors
(A) Schematic depiction of a very simplified model of bacterial growth capturing resource allocation to DNA, ribosomes and proteins. Ribosome synthesis is assumed to be optimally regulated by resource concentration. See Supplemental Data for the complete mathematical model. (B) Growth rate obtained from the model for WT, rrn operon deletions and relA spoT deletions in the absence of antibiotics (black line) and in the presence of DNA synthesis inhibitor (red line), cf. Figure 5A. (C) Change of total protein per cell under translation inhibition (blue) or DNA synthesis inhibition (red), cf. Figure 2C. Inset shows total protein per cell at g=0.15. (D) Normalized ribosomal expression level εribos (corresponds to ribosomal protein fraction η in the model, see Supplemental Data) as a function of growth rate under reduced nutrient availability (gray), translation inhibition (blue), or DNA synthesis inhibition (red). Ribosome synthesis is similarly down-regulated in response to reduced nutrient availability or DNA synthesis inhibition and is up-regulated in response to translation inhibition, cf. Figure 3D. (E) Quantified level of suppression in the different strains, cf. Figure 6D. Parameters as in Table S3 with resource influx νa=15 h−1 which leads to a growth rate g=1.3 h−1 in absence of antibiotics, for details see Supplemental Data.

Similar articles

Cited by

References

    1. Asai T, Condon C, Voulgaris J, Zaporojets D, Shen B, Al-Omar M, Squires C, Squires CL. Construction and initial characterization of Escherichia coli strains with few or no intact chromosomal rRNA operons. J Bacteriol. 1999;181:3803–3809. - PMC - PubMed
    1. Balaban NQ, Merrin J, Chait R, Kowalik L, Leibler S. Bacterial persistence as a phenotypic switch. Science. 2004;305:1622–1625. - PubMed
    1. Barker MM, Gaal T, Gourse RL. Mechanism of regulation of transcription initiation by ppGpp. II. Models for positive control based on properties of RNAP mutants and competition for RNAP. J Mol Biol. 2001;305:689–702. - PubMed
    1. Bartlett MS, Gourse RL. Growth rate-dependent control of the rrnB P1 core promoter in Escherichia coli. J Bacteriol. 1994;176:5560–5564. - PMC - PubMed
    1. Bliss CI. The toxicity of poisons applied jointly. Annals of Applied Biology. 1939;26:585–615.

Publication types

MeSH terms