. 2009 Nov 12;64(3):355-366.
doi: 10.1016/j.neuron.2009.09.018.

Extracellular Engrailed participates in the topographic guidance of retinal axons in vivo

Affiliations

Extracellular Engrailed participates in the topographic guidance of retinal axons in vivo

Andrea Wizenmann et al. Neuron. .

Abstract

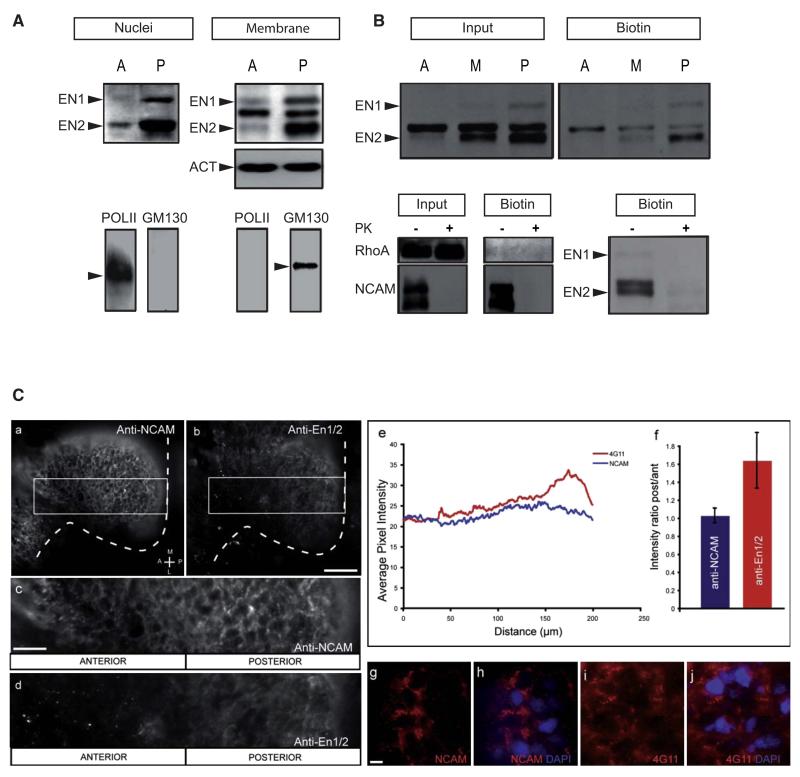
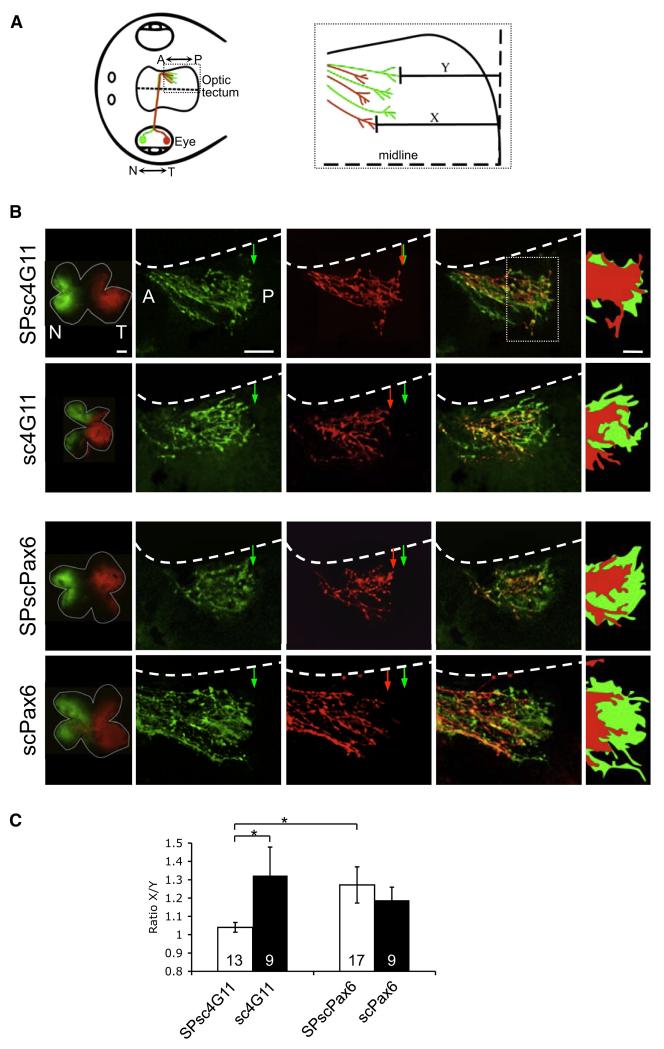
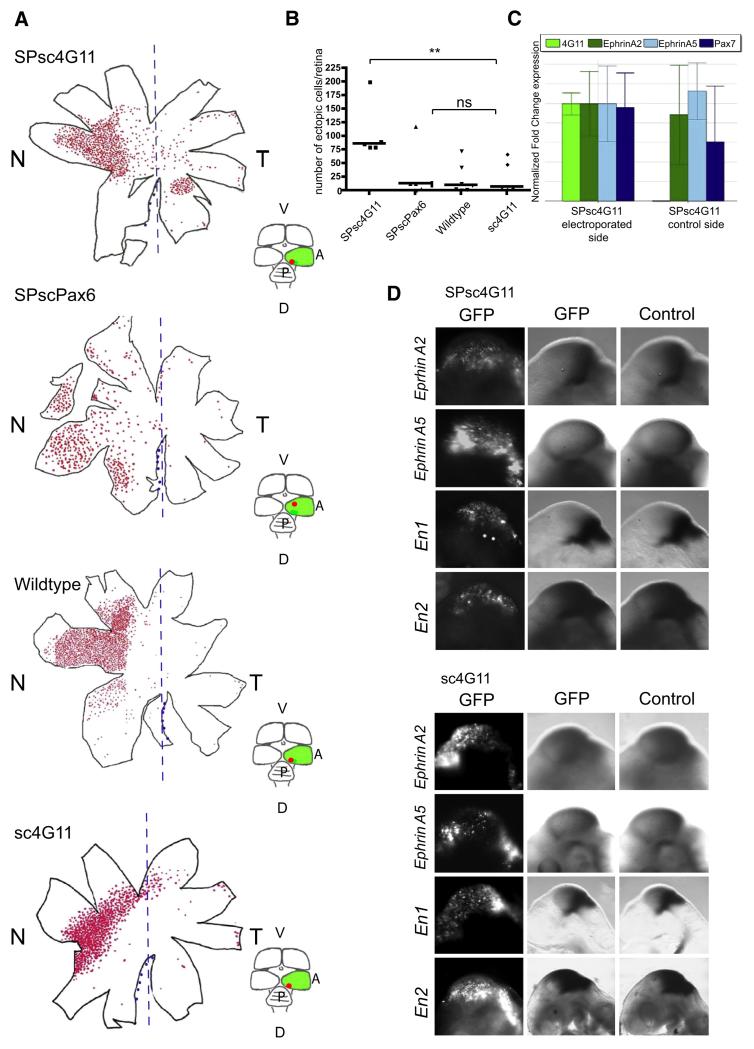
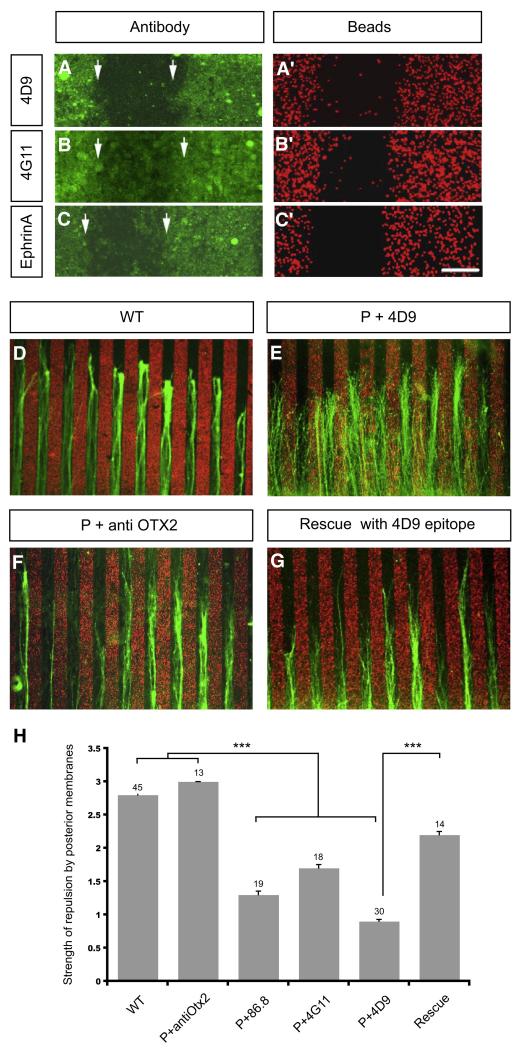
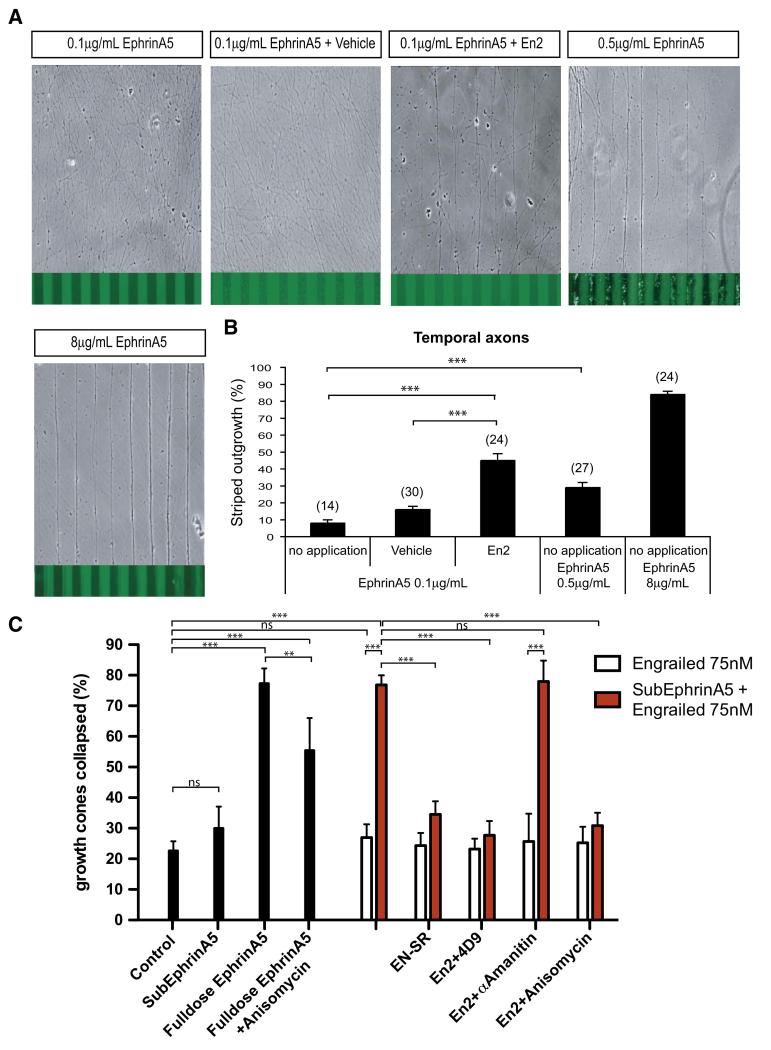
Engrailed transcription factors regulate the expression of guidance cues that pattern retinal axon terminals in the dorsal midbrain. They also act directly to guide axon growth in vitro. We show here that an extracellular En gradient exists in the tectum along the anterior-posterior axis. Neutralizing extracellular Engrailed in vivo with antibodies expressed in the tectum causes temporal axons to map aberrantly to the posterior tectum in chick and Xenopus. Furthermore, posterior membranes from wild-type tecta incubated with anti-Engrailed antibodies or posterior membranes from Engrailed-1 knockout mice exhibit diminished repulsive activity for temporal axons. Since EphrinAs play a major role in anterior-posterior mapping, we tested whether Engrailed cooperates with EphrinA5 in vitro. We find that Engrailed restores full repulsion to axons given subthreshold doses of EphrinA5. Collectively, our results indicate that extracellular Engrailed contributes to retinotectal mapping in vivo by modulating the sensitivity of growth cones to EphrinA.


Figures

Figure 1
Figure 1. Engrailed proteins are associated with tectal membranes in a A-P gradient
(A) Chick Engrailed 1/2 proteins are associated with Anterior (A) and posterior (P) membranes, which stain for ER/Golgi marker GM130 and actin. En1/2 is also present in nuclei identified by Pol-II. The equal intensities of actin and extracellular Hsc70 contaminant (migrating between En1 and En2) bands demonstrate that equal amounts of material were loaded in A and P slots. (B) Tecta from E4 chick embryos were cultured (flat mount) for one day and cell surface proteins were biotinylated. The proteins from anterior (A), median (M) and posterior (P) domains were extracted and biotinylated proteins were retained on streptavidin columns. Top panels: Total extracts (input) show a En1/2 graded expression also observed for surface (Biotin) En1/2. Bottom panels: Total input shows both extracellular (NCAM) and intracellular protein (RhoA). RhoA is not biotinylated and only NCAM, but not RhoA, is degraded by proteinase K. (C) Dorsal view of stage 37/38 flat-mounted tecta showing extracellular immunostaining with antibodies to NCAM (a) and En1/2 (b). White dashed lines demarcate the posterior and lateral tectal border (isthmus is posterior). Boxed regions in C and D shown at higher magnification below (c, d) indicate the area typically used for quantification. (e) Pixel intensity per unit area was measured along the anterior-posterior axis (Engrailed-1/2, red; n=5. NCAM, blue; n=4) where zero value corresponds to the anterior tectal boundary. Bar graph (e) shows the ratio of the mean pixel intensity values of the extreme anterior and posterior 50μm of the tectum. NCAM (g) and En1/2 (i) immunostaining (red) patterns are extracellular/membranous in the non-permeabilized conditions used and does not co-localize with nuclear DAPI (blue) signal (merged images in h, j).
Figure 2
Figure 2. Tectal expression of single-chain En1/2 antibody disrupts mapping in Xenopus
(A) Schematic diagram of the Xenopus retinotectal projection (dorsal view). Nasal axons (green) project to the contralateral posterior optic tectum and temporal axons (red) to the anterior tectum. Area in dashed box is enlarged in the right panel. The topographic position of axon terminals was quantified by measuring the distance from the posterior tectal border (dashed vertical line) to the tips of temporal and nasal axons to give values X (temporal) and Y (nasal). (B) Dorsal views of tecta showing anterogradely labeled retinal axons in single chain antibody-expressing tecta. Far left panel shows the sites of dye injection in flat-mounted retinas belonging to the tectal samples on the right. Temporal axons (red, DiI) extend aberrantly and as far as nasal axons (green, DiO) in tecta expressing SPsc4G11, but not in those expressing sc4G11, SPscPax6 and scPAX6. Position of the furthest extending nasal axon (green arrow) and temporal axon (red arrow) and lateral boundary of the tectum (white dashed line) are shown. Far right panels show a solid-filled outline of the two populations of axons to give a clearer visual representation of the degree of overlap. Scale bars: retina, 100μm; tectum, 50μm; outline tracing, 25μm. (C) Mean X/Y ratios in tecta expressing secreted (white) or non-secreted antibodies (black). Normal topographic mapping gives a X/Y ratio >1, whereas a lower ratio indicates topographic defects. Numbers in the bars denote the number of tecta analyzed. Data are SPscPax6 or scPax6 groups (*p < 0.05; Kruskal-Wallis test). A, anterior; N, nasal; P, posterior; T, temporal.
Figure 3
Figure 3. Interfering in vivo with Engrailed intercellular signaling disrupts topographic mapping in chick
(A) Temporal retinal ganglion cells were labeled by insertion of a DiI crystal in the posterior tectum expressing SPsc4G11, sc4G11, SPscPax6 or none of those (WT). To the left are camera lucida drawings of retinas where retrogradely labeled ganglion cells are indicated by red dots. The retinas are oriented with dorsal at the top, nasal (N) at the left and temporal (T) at the right. The scheme of the brains to the right of the retinas show the placement of the DiI crystal in the posterior part of the tectum (at that time the chick tectum has turned 90 degrees, thus the posterior end becomes located towards the middle of the brain). (B) Quantification of misplaced temporal projections show that in tecta transfected with SPsc4G11 a significantly higher portion of temporal retinal cells was labeled (Student t- test). (C) E4 tecta were electroporated at E4 with the SPsc4G11 expressing plasmid and the effect of this expression on EphrinA2/5 and Pax7 expression was analyzed at E5 by RT-PCR. This figure illustrates the unilateral expression of the antibody (4G11) and the equal amounts of EphrinA2/A5 and Pax7 in the electroporated and contralateral sides. (D) Chick tecta were electroporated at E2 with plasmids encoding SPsc4G11 or sc4G11 and fixed at E3. Whole mount RNA ISH against EphrinA2, EphrinA2, En1 and En2 were performed. The expression patterns of Ephrin and Engrailed mRNA on the side transfected with SPsc4G11 (upper picture) and sc4G11 (lower picture) are shown in the GFP expressing tectum (first and second row of pictures). The last row of pictures shows the mRNA expression of the not electroporated side.
Figure 4
Figure 4. Engrailed is necessary for full temporal cone repulsion in the stripe assay
(A-C’) Alternating lanes of anterior and posterior membranes were stained with 4D9 (A) and 4G11 (B) anti-Engrailed antibodies and with an anti-EphrinA2 (C) antibody. The fluorescent beads (carboxylate-modified microspheres 0.5μm, red fluorescent from Molecular Probes) (A’-C’) indicate posterior membranes. Arrows in A-C show the border between posterior and anterior membrane stripes. Scale bar: 45μm. (D-G) Axonal outgrowth of temporal axons in stripe assays, where posterior membranes were untreated (D) pre-incubated with the 4D9 anti-Engrailed antibody (E), the anti-Otx2 antibody (F) or the 4D9 antibody neutralized with the epitope (G). Pre-incubation of posterior membranes with the Engrailed antibody blurred the anterior preference of temporal axons (E), the Otx2 antibody had no effect (F) and neutralizing the Engrailed antibody restored a normal growth pattern (G). Posterior is in red, anterior is in black. (H) Quantification of temporal (T) repulsion (3 for maximal repulsion, 0 for no repulsion). Anti-Otx2 had no effect compared to WT. The polyclonal (86.8) and the two monoclonal anti-En1/2 antibodies (4G11 and 4D9) reduced the repulsive effect of posterior membranes on temporal axons to a score of 1.5 (Mann Whitney test, ***: p<0.001 for each control column compared to each anti-Engrailed treated column). Neutralizing the 4D9 antibody with its epitope restored repulsion (rescue, ***: p<0.001, Mann Whitney test). Numbers in parenthesis indicate the number of explants analyzed. Analysis of variance showed a significant group effect (p< 0.001, ANOVA test).
Figure 5
Figure 5. EphrinA5 and En2 cooperate in vitro for axonal guidance and growth cone collapse
(A) Top panels illustrate typical random outgrowth observed with sub-threshold (0.1μg/mL) EphrinA5 concentration and demonstrate that the addition of En2 at a 75nM concentration but not of the vehicle (En2 buffer) restores striped outgrowth, comparable with the striped outgrowth pattern observed at 0.5μg/mL EphrinA5. The bottom picture shows clear striped outgrowth obtained with high EphrinA5 (8μg/mL). EphrinA5 is in green. (B) Quantification of striped outgrowth observed when axons are growing on three different EphrinA5 concentrations (0.1μg/mL, 0.5μg/mL and 8μg/mL). At 0.1μg/mL, growth is almost entirely random whereas at a 0.5μg/mL concentration, 1/3 of the axons show a striped outgrowth pattern. Adding En2 in the medium of axons growing on 0.1μg/mL EphrinA5 increases the percentage of axons that show striped outgrowth to a value similar to that observed on 0.5μg/mL EphrinA5. Numbers in parenthesis indicate the number of experiments. *** p ≤ 0.0001 using Student t-test. (C) Chick temporal axons were submitted to a collapse-inducing (Full dose EphrinA5) concentration of EphrinA5 (10μg/mL) or to a concentration of 0.1μg/mL that has no effect per se (sub-EphrinA5). Growth cone collapse was tested in the presence of En2 alone (empty bars, 75nM) or of EphrinA5 (0.1μg/mL) plus En2 (75 nM) (red bars). This graph illustrates how En2 lowers the threshold of EphrinA5-induced collapse. Non-internalized En2 (EnSR) or antibody-neutralized En2 are without effect. En2 activity is translation dependent and transcription independent. Full-EphrinA5 activity is partially translation dependent. Experiments were repeated 3 to 6 independent times, and the total number of growth cones counted for each condition range between 600 and 2400 (*** p ≤ 0.0022 and ** p ≤ 0.0043, Mann-Whitney two-tailed U-test).

Similar articles

Cited by

References

    1. Auerbach R, Kubai L, Knighton D, Folkman J. A simple procedure for the long-term cultivation of chicken embryos. Dev Biol. 1974;41:391–394. - PubMed
    1. Auf der Maur A, Tissot K, Barberis A. Antigen-independent selection of intracellular stable antibody frameworks. Methods. 2004;34:215–224. - PubMed
    1. Bovolenta P. Morphogen signaling at the vertebrate growth cone: a few cases or a general strategy? J Neurobiol. 2005;64:405–416. - PubMed
    1. Brunet I, Di Nardo AA, Sonnier L, Beurdeley M, Prochiantz A. The topological role of homeoproteins in the developing central nervous system. Trends in Neurosci. 2007 In press. - PubMed
    1. Brunet I, Weinl C, Piper M, Trembleau A, Volovitch M, Harris W, Prochiantz A, Holt C. The transcription factor Engrailed-2 guides retinal axons. Nature. 2005;438:94–98. - PMC - PubMed

Publication types

MeSH terms

LinkOut - more resources