. 2009 Nov 12;64(3):404-18.
doi: 10.1016/j.neuron.2009.09.020.

Laminar structure of spontaneous and sensory-evoked population activity in auditory cortex

Affiliations

Laminar structure of spontaneous and sensory-evoked population activity in auditory cortex

Shuzo Sakata et al. Neuron. .

Abstract

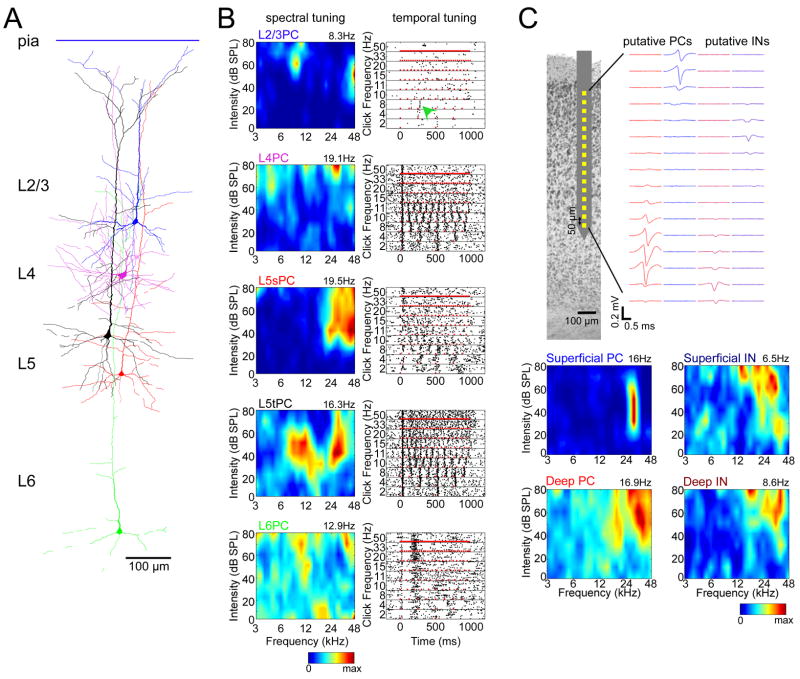
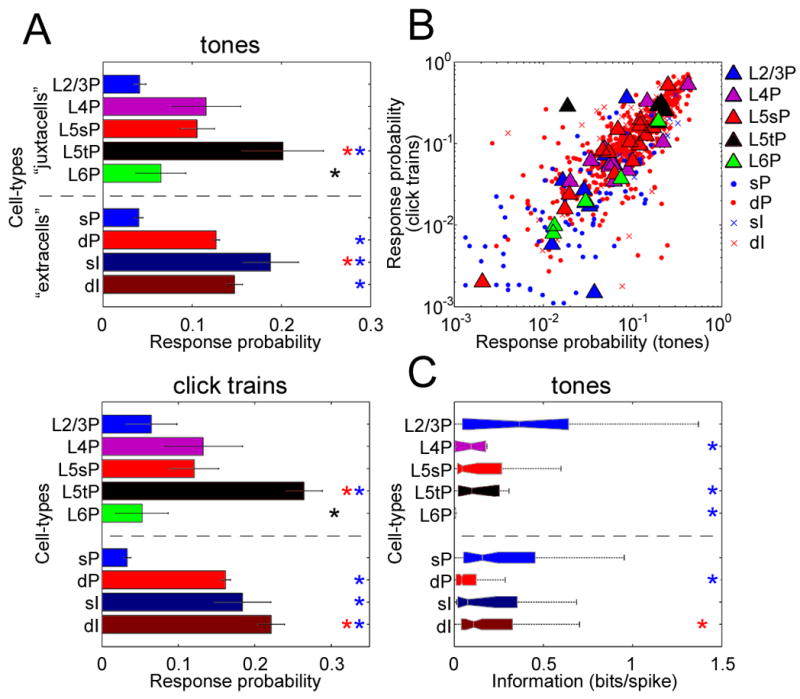
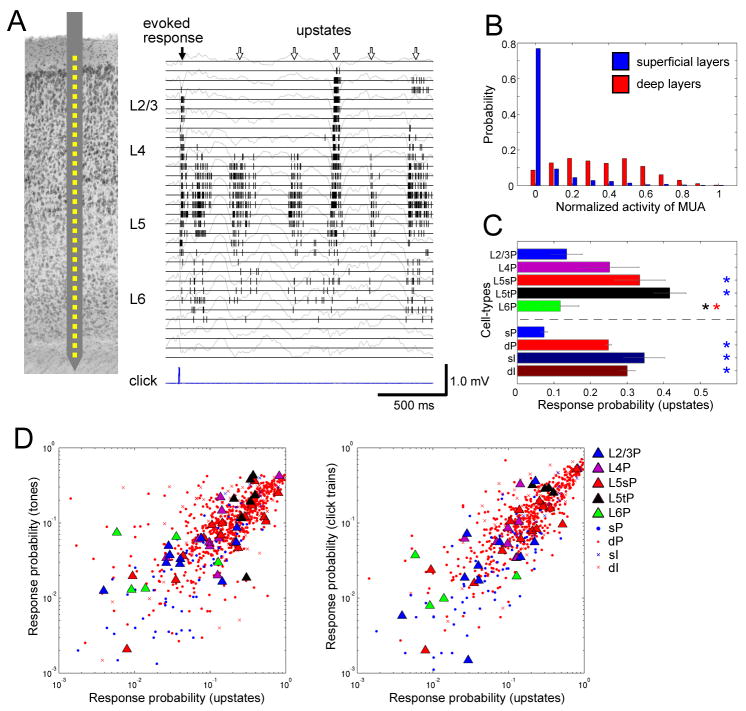
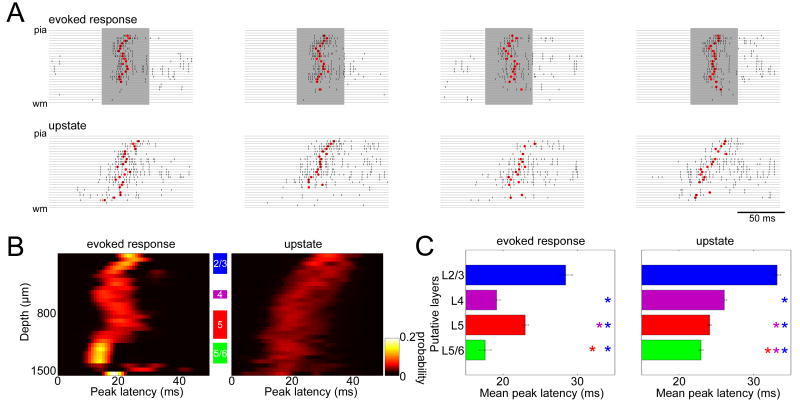
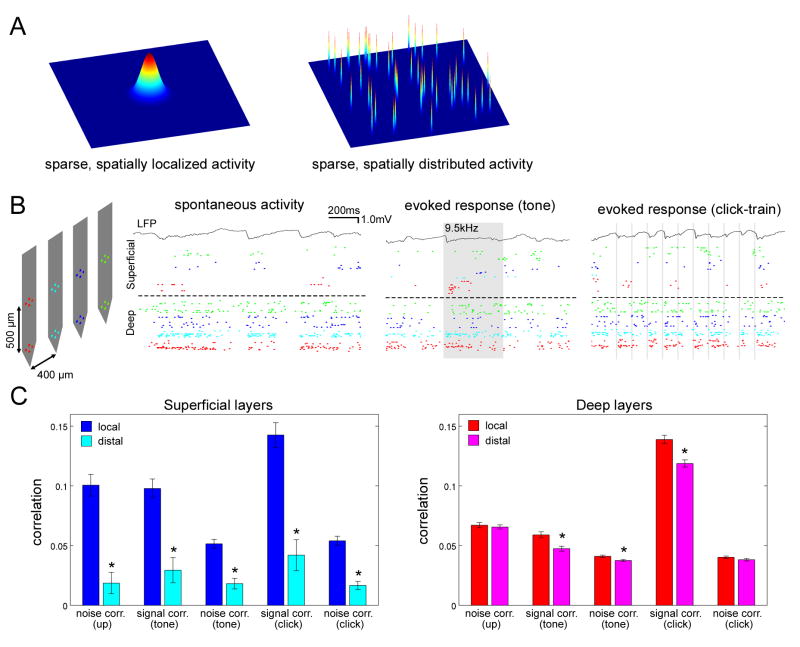
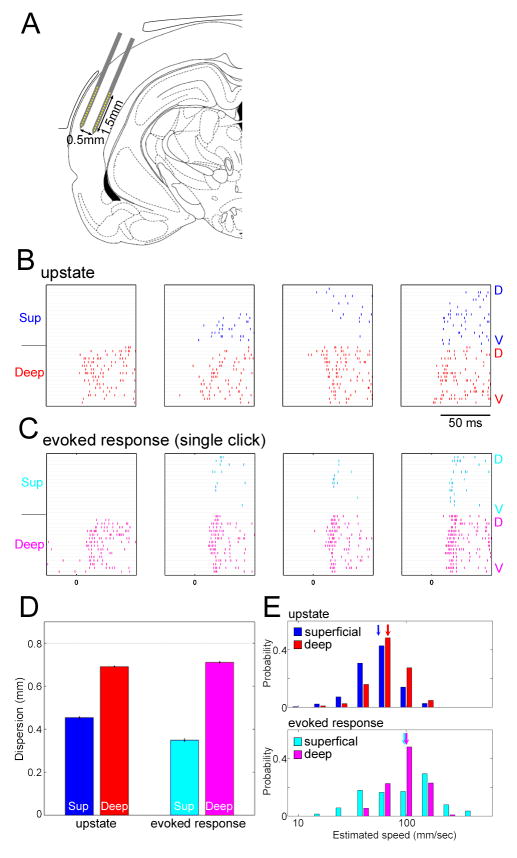
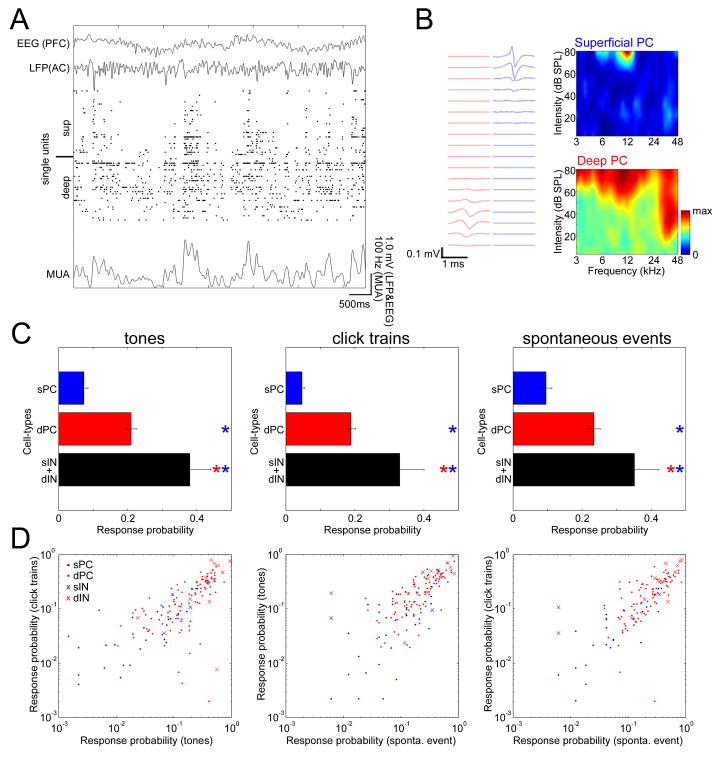
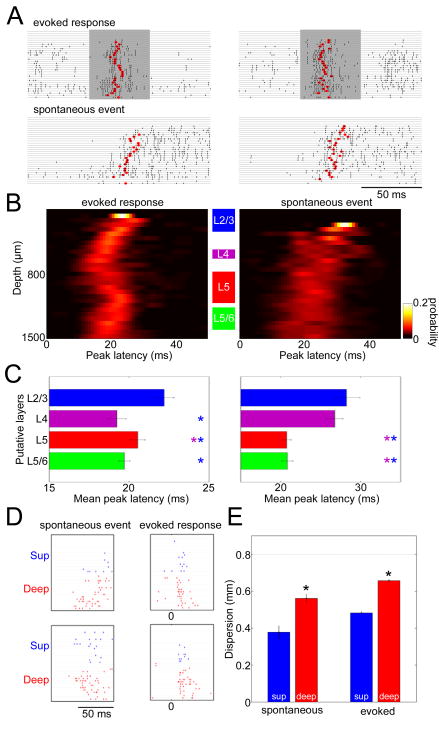
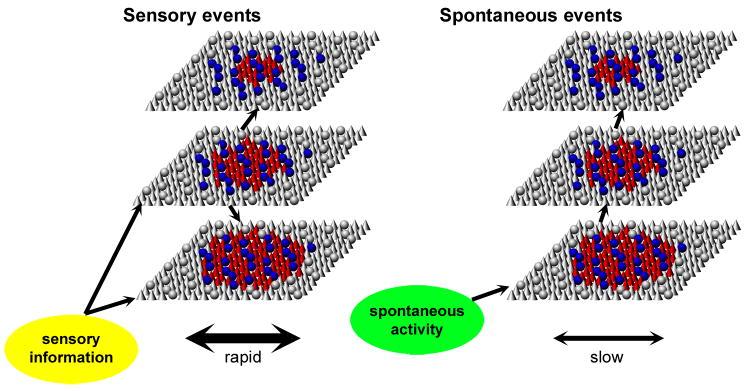
Spontaneous activity plays an important role in the function of neural circuits. Although many similarities between spontaneous and sensory-evoked neocortical activity have been reported, little is known about consistent differences between them. Here, using simultaneously recorded cortical populations and morphologically identified pyramidal cells, we compare the laminar structure of spontaneous and sensory-evoked population activity in rat auditory cortex. Spontaneous and evoked patterns both exhibited sparse, spatially localized activity in layer 2/3 pyramidal cells, with densely distributed activity in larger layer 5 pyramidal cells and putative interneurons. However, the propagation of spontaneous and evoked activity differed, with spontaneous activity spreading upward from deep layers and slowly across columns, but sensory responses initiating in presumptive thalamorecipient layers, spreading rapidly across columns. The similarity of sparseness patterns for both neural events and distinct spread of activity may reflect similarity of local processing and differences in the flow of information through cortical circuits, respectively.


Figures

Figure 1
Figure 1. Tuning profiles of example neurons
(A) Examples of five juxtacellularly recorded pyramidal cells (PCs), digitally superimposed. (B) Spectral and temporal tuning of the neurons shown in (A). Left, responses to pure tones. Each plot shows a pseudocolor representation of the cell s mean firing rate in a 50ms period following tone onsets, as a function of tone frequency and intensity. The number above each plot indicates maximum firing rate. Right, responses to click trains. Each plot shows a raster representation of the cell s response to repeated presentations of click trains of varying frequencies. Red marks indicate click (5-ms white noise) onsets. Green arrowhead: the example L2/3 PC responded sparsely to click train stimuli, with reliable firing seen only to the 3rd click of an 8Hz train. L5sPC, L5 slender PC; L5tPC, L5 thick PC. (C) Tuning of four representative cells identified from silicon probe recordings. Top, schematic drawing of electrode, and average spike waveform profiles of a putative deep PC, superficial PC, deep interneuron(IN), and superficial IN. Bottom, spectral tuning of these cells.
Figure 2
Figure 2. Sparseness of sensory responses varies between cell classes
(A) Sparseness was assessed using a “response probability” measure, for which smaller values indicate sparser firing (see text). Bars above and below dotted line indicate cell-classes identified morphologically by juxtacellular recording (“juxtacells”), and silicon probe-recorded units putatively classified by spike waveform (“extracells”), respectively. Asterisks denote pairwise post-hoc lsd tests, indicating a significant difference (p<0.05) to the class corresponding to that color. Post-hoc comparisons were performed for juxtacells and extracells separately. sP, superficial PCs; dP, deep PCs; sI, superficial INs; dI, deep INs. Error bars indicate SE. (B) Sparseness is correlated across stimulus types. Each symbol shows the response probability of one cell to tone and click stimuli, with large symbols indicating juxtacells. (C) Information-theoretic analysis. L2/3PCs showed greater predictability from the presented tone, measured in bits/spike, than L4PCs, L5tPCs and L6PCs (ANOVA with post-hoc lsd test, p<0.01).
Figure 3
Figure 3. Sparseness varies between cell classes during spontaneous activity
(A) Left, schematic drawing of recording by a 32-site linear electrode. Right, raster plot of multi-unit activity (MUA) for each channel, superimposed on local-field potentials (gray traces). (B) Probability distributions of normalized MUA spike count across upstates, for superficial (putative L2/3) and deep (putative L5) layers (2082 upstates from 5 datasets). Distribution of superficial MUA differs significantly from that of deep layers (Kolmogorov-Smirnov test, p<0.0001). (C) Response probability measure of firing sparseness for upstates, for all cell types (c.f. Figure 2A). (D) Correlation of response probability between sensory responses and upstates (c.f. Figure 2B).
Figure 4
Figure 4. Spread of activity across layers differs between sensory responses and upstates
(A) Example laminar profiles of upstates and evoked responses. Rasters indicate MUA of all channels on a 32-site linear probe for individual upstates and evoked responses. Shaded periods indicate tone presentations. Red dots indicate “peak latency,” computed as the median MUA spike time in a 50-ms window after event onset. (B) Laminar profiles of peak latency for tone-evoked responses (best frequency, 60–80 dB SPL) and upstates. The graphs show a pseudocolor histogram of the distribution of peak latency as a function of depth, revealing temporal sequence of activity across layers. Data accumulated from all experiments with 32-site linear probes (N=5). (C) Statistical summary of peak latency for putative layers corresponding to the shaded areas in (B). Each bar shows mean and SE of peak latency measure across all experiments. For evoked responses, activity started in putative L4 and the L5/6 border. For upstates, activity started in deep layers. Colored asterisks indicate significant post-hoc comparisons (lsd test, p<0.05).
Figure 5
Figure 5. Laminar-dependent structure of correlated activity
(A) Two possible models for sparse population activity. Left, sparse, spatially localized model; right, sparse, spatially distributed model. (B) Example extracellular recordings spanning multiple columns. Left, Probe configuration. Right, Spontaneous and sensory-evoked activity of simultaneously recorded cells. Rasters above and below the dashed line correspond to recording sites in superficial (putative L2/3) and deep (putative L5) layers, respectively. Colors of each raster correspond to colors of recording sites in schematic. Shaded areas denote periods of tone and click presentations. (C) Spatial dependence of spike count correlation in superficial (left) and deep (right) layers. Asterisks indicate significant post-hoc comparisons (lsd test, p<0.05). Error bars indicate SE.
Figure 6
Figure 6. Spatiotemporal dispersion of population activity
(A) Two-shank multisite electrodes (2×16 linear probe) were inserted parallel to the layers of auditory cortex. A part of the drawing was replicated from (Paxinos and Watson, 1997). (B,C) Examples of spatiotemporal patters for upstates (B) and click-evoked responses (C). Each plot shows rasters of MUA on all recording sites, with superficial and deep shanks on top and bottom. The sites on each shank are arranged from dorsal (D) to ventral (V). Superficial activity was sparse and local for both types of event. While upstates sometimes spread as a traveling wave, evoked responses typically appeared with near-synchrony across columns. (D) Dispersion of activity was quantified by the spatial inter-quartile range of MUA spike counts across recording sites in a 50ms window after event onset (see Experimental Procedures). Dispersion in superficial layers was restricted compared to that in deep layers (ANOVA with post hoc lsd test, p<0.0001). Error bars indicate SE. (E) Distribution of propagation speeds for upstates (top) and evoked responses (bottom), estimated as the regression slope of median MUA time across recording sites (Luczak et al., 2007; see also Figure S13). Arrows indicate the median, and the x-axis is log-scaled. Propagation speed was faster for evoked responses than for upstates in both layers (ANOVA with post hoc lsd test, p<0.0001).
Figure 7
Figure 7. Cell-type dependent sparseness of spontaneous and evoked activity in unanesthetized animals
(A) Raster of simultaneously recorded spike-sorted units showing spontaneous fluctuations of population activity in a head-restrained, unanesthetized animal. Also shown are electroencephalogram (EEG) recorded from the prefrontal cortical (PFC) area with a screw, local-field potential (LFP) recorded locally (AC, auditory cortex), and multiunit activity (MUA), calculated by summation of firing of all single units and smoothing with a 70-ms Gaussian kernel. (B) Left, example waveform profiles of simultaneously recorded putative superficial and deep PCs. Right, spectral tuning of example cells. (C) Response probabilities of extracellularly recorded cells for tones (left), click trains (center), and spontaneous events (right), indicating sparser activity of superficial putative PCs than those of deep putative PCs and putative INs (ANOVA with post hoc lsd test, p<0.0001 in all cases) (c.f. Figures 2A and 3C). Asterisks denote pairwise post-hoc lsd tests, indicating a significant difference (p<0.05) to the class corresponding to that color. sP, superficial PCs; dP, deep PCs; sI, superficial INs; dI, deep INs. Error bars indicate SE. (D) Sparseness is correlated across event types (r=0.80, p<0.0001 in left; r=0.73, p<0.0001 in center; r=0.72, p<0.0001 in right). Each symbol shows the response probability of one cell to tone and click stimuli (left), tone stimuli and spontaneous events (center), and click stimuli and spontaneous events (right) (c.f. Figures 2C and 3D).
Figure 8
Figure 8. Spatiotemporal structure of evoked and spontaneous activity in unanesthetized animals
(A) Example laminar MUA rasters for evoked responses and spontaneous events (c.f. Figure 4A). (B) Laminar profiles of peak latency for tone-evoked responses and spontaneous events. The graphs show a pseudocolor histogram of the distribution of peak latency as a function of depth, revealing temporal sequence of activity across layers. Data accumulated from all experiments with 32-site linear probes (N=5; c.f. Figure 4B). (C) Laminar profiles of mean peak latency (5 datasets; c.f. Figure 4C). Colored asterisks indicate significant post-hoc comparisons (p<0.05). Error bars indicate SE. (D) Example spatiotemporal patters for spontaneous events and click-evoked responses recorded by two-shank multisite electrodes (c.f. Figures 6A–C). (E) Spatial dispersion of activity (c.f. Figure 6D). Error bars indicate SE.
Figure 9
Figure 9. Hypothesized flow of sensory-evoked and spontaneous activity through auditory cortical circuits
Each sheet represents a population of the corresponding layer, with cones and spheres representing PCs and INs, respectively. Colored symbols represent active neurons. For both types of activity, pyramidal cells exhibited dense and distributed activity in the deep layers, but sparse and localized activity in the superficial layers; interneurons show a pattern of activity similar to that of deep layer pyramidal cells. For sensory responses, earliest firing is seen in cells of the middle and deep layers, presumably reflecting the strongest afferent input onto these neurons. For spontaneous events, activity spread upward from the deep layers.

Comment in

  • Cortical dynamics by layers.
    Crochet S, Petersen CC. Crochet S, et al. Neuron. 2009 Nov 12;64(3):298-300. doi: 10.1016/j.neuron.2009.10.024. Neuron. 2009. PMID: 19914177

References

    1. Averbeck BB, Latham PE, Pouget A. Neural correlations, population coding and computation. Nat Rev Neurosci. 2006;7:358–366. - PubMed
    1. Barlow HB. Single units and sensation: a neuron doctrine for perceptual psychology? Perception. 1972;1:371–394. - PubMed
    1. Barnes CA, McNaughton BL, Mizumori SJ, Leonard BW, Lin LH. Comparison of spatial and temporal characteristics of neuronal activity in sequential stages of hippocampal processing. Prog Brain Res. 1990;83:287–300. - PubMed
    1. Berger T, Borgdorff A, Crochet S, Neubauer FB, Lefort S, Fauvet B, Ferezou I, Carleton A, Luscher HR, Petersen CC. Combined voltage and calcium epifluorescence imaging in vitro and in vivo reveals subthreshold and suprathreshold dynamics of mouse barrel cortex. J Neurophysiol. 2007;97:3751–3762. - PubMed
    1. Bitterman Y, Mukamel R, Malach R, Fried I, Nelken I. Ultra-fine frequency tuning revealed in single neurons of human auditory cortex. Nature. 2008;451:197–201. - PMC - PubMed

Publication types

MeSH terms