

Temporoparietal atrophy: a marker of AD pathology independent of clinical diagnosis
- PMID: 19914744
- PMCID: PMC2888989
- DOI: 10.1016/j.neurobiolaging.2009.10.012
Temporoparietal atrophy: a marker of AD pathology independent of clinical diagnosis
Abstract
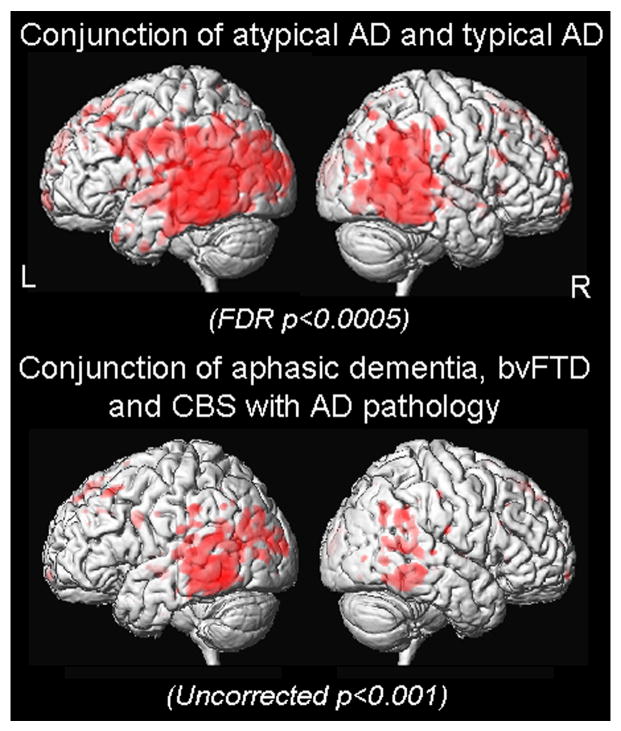
Alzheimer's disease (AD) can present with non-amnestic clinical syndromes. We investigated whether there is an imaging signature of AD pathology in these atypical subjects. We identified 14 subjects that had pathological AD, a non-amnestic presentation (i.e. atypical AD), and MRI. These subjects were matched to 14 with clinical and pathological AD (i.e. typical AD), 14 with the same non-amnestic presentations with frontotemporal lobar degeneration (FTLD) pathology, and 20 controls. Voxel-based morphometry and region-of-interest (ROI) analysis were used to assess patterns of grey matter loss. Loss was observed in the temporoparietal cortex in both typical and atypical AD, and showed significantly greater loss than FTLD. However, the medial temporal lobes were more severely affected in typical AD and FTLD compared to atypical AD. A ratio of hippocampal and temporoparietal volumes provided excellent discrimination of atypical AD from FTLD subjects. Temporoparietal atrophy may therefore provide a useful marker of the presence of AD pathology even in subjects with atypical clinical presentations, especially in the context of relative sparing of the hippocampus.
Copyright © 2009 Elsevier Inc. All rights reserved.
Conflict of interest statement
The authors have no conflicts of interest.
Figures


References
-
- Alladi S, Xuereb J, Bak T, Nestor P, Knibb J, Patterson K, Hodges JR. Focal cortical presentations of Alzheimer's disease. Brain. 2007;130:2636–2645. - PubMed
-
- Ashburner J, Friston KJ. Voxel-based morphometry--the methods. Neuroimage. 2000;11:805–821. - PubMed
-
- Ashburner J, Friston KJ. Unified segmentation. Neuroimage. 2005;26:839–851. - PubMed
-
- Barnes J, Whitwell JL, Frost C, Josephs KA, Rossor M, Fox NC. Measurements of the amygdala and hippocampus in pathologically confirmed Alzheimer disease and frontotemporal lobar degeneration. Arch Neurol. 2006;63:1434–1439. - PubMed
-
- Baron JC, Chetelat G, Desgranges B, Perchey G, Landeau B, de la Sayette V, Eustache F. In vivo mapping of gray matter loss with voxel-based morphometry in mild Alzheimer's disease. Neuroimage. 2001;14:298–309. - PubMed
Publication types
MeSH terms
Substances
Grants and funding
LinkOut - more resources
Full Text Sources
Medical
