

Protection of thylakoids against combined light and drought by a lumenal substance in the resurrection plant Haberlea rhodopensis
- PMID: 19914917
- PMCID: PMC2794074
- DOI: 10.1093/aob/mcp274
Protection of thylakoids against combined light and drought by a lumenal substance in the resurrection plant Haberlea rhodopensis
Abstract
Background and aims: Haberlea rhodopensis is a perennial, herbaceous, saxicolous, poikilohydric flowering plant that is able to survive desiccation to air-dried state under irradiance below 30 micromol m-2 s-1. However, desiccation at irradiance of 350 micromol m-2 s-1 induced irreversible changes in the photosynthetic apparatus, and mature leaves did not recover after rehydration. The aim here was to establish the causes and mechanisms of irreversible damage of the photosynthetic apparatus due to dehydration at high irradiance, and to elucidate the mechanisms determining recovery.
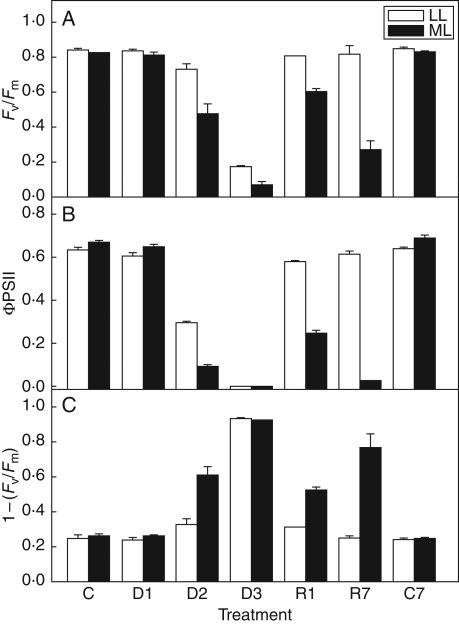
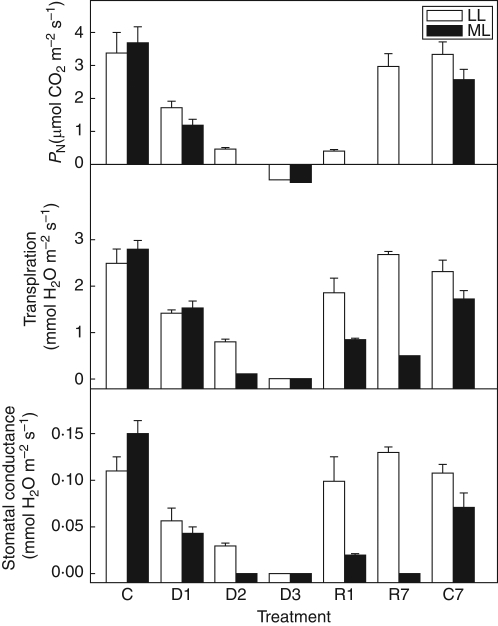
Methods: Changes in chloroplast structure, CO2 assimilation, chlorophyll fluorescence parameters, fluorescence imaging and the polypeptide patterns during desiccation of Haberlea under medium (100 micromol m-2 s-1; ML) irradiance were compared with those under low (30 micromol m-2 s-1; LL) irradiance.
Key results: Well-watered plants (control) at 100 micromol m-2 s-1 were not damaged. Plants desiccated at LL or ML had similar rates of water loss. Dehydration at ML decreased the quantum efficiency of photosystem II photochemistry, and particularly the CO2 assimilation rate, more rapidly than at LL. Dehydration induced accumulation of stress proteins in leaves under both LL and ML. Photosynthetic activity and polypeptide composition were completely restored in LL plants after 1 week of rehydration, but changes persisted under ML conditions. Electron microscopy of structural changes in the chloroplast showed that the thylakoid lumen is filled with an electron-dense substance (dense luminal substance, DLS), while the thylakoid membranes are lightly stained. Upon dehydration and rehydration the DLS thinned and disappeared, the time course largely depending on the illumination: whereas DLS persisted during desiccation and started to disappear during late recovery under LL, it disappeared from the onset of dehydration and later was completely lost under ML.
Conclusions: Accumulation of DLS (possibly phenolics) in the thylakoid lumen is demonstrated and is proposed as a mechanism protecting the thylakoid membranes of H. rhodopensis during desiccation and recovery under LL. Disappearance of DLS during desiccation in ML could leave the thylakoid membranes without protection, allowing oxidative damage during dehydration and the initial rehydration, thus preventing recovery of photosynthesis.
Figures


References
-
- Apel K, Hirt H. Reactive oxygen species: metabolism, oxidative stress, and signal transduction. Annual Review of Plant Biology. 2004;55:373–399. - PubMed
-
- Apostol S, Viau AA, Tremblay N, et al. Laser-induced fluorescence signatures as a tool for remote monitoring of water and nitrogen stresses in plants. Canadian Journal of Remote Sensing. 2003;29:57–65.
-
- Bartels D. Desiccation tolerance studied in the resurrection plant Craterostigma plantagineum. Integrative and Comparative Biology. 2005;45:696–701. - PubMed
-
- Buschmann C, Langsdorf G, Lichtenthaler HK. Imaging of blue, green, and red fluorescence emission of plants: an overview. Photosynthetica. 2000;38:483–491.
-
- von Caemmerer S, Farquhar GD. Some relationships between the biochemistry of photosynthesis and the gas exchange of leaves. Planta. 1981;153:376–387. - PubMed
