. 2010 Jan;38(2):695-707.
doi: 10.1093/nar/gkp1003. Epub 2009 Nov 13.

Probing the (H3-H4)2 histone tetramer structure using pulsed EPR spectroscopy combined with site-directed spin labelling

Affiliations

Probing the (H3-H4)2 histone tetramer structure using pulsed EPR spectroscopy combined with site-directed spin labelling

Andrew Bowman et al. Nucleic Acids Res. 2010 Jan.

Abstract

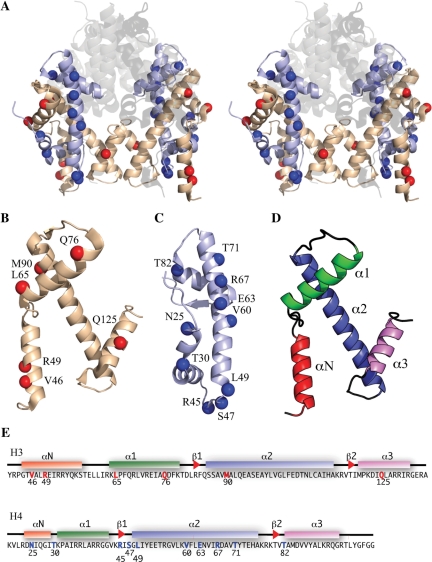
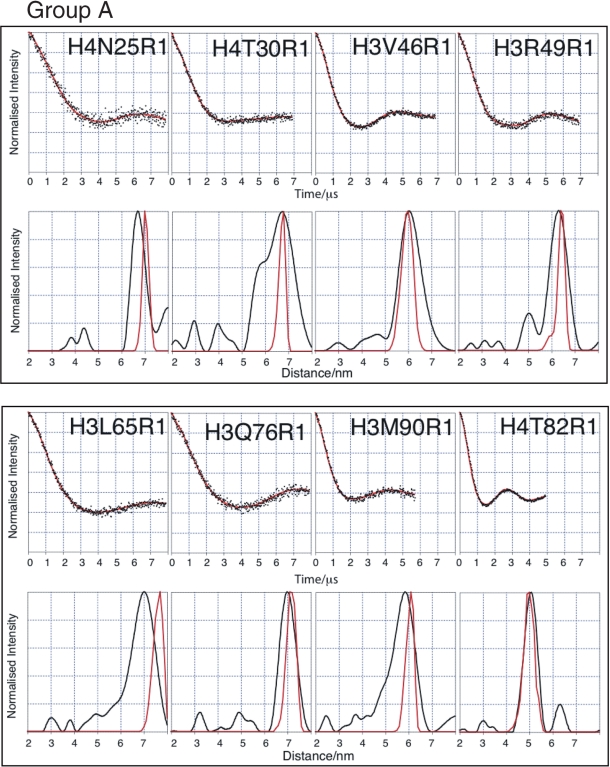
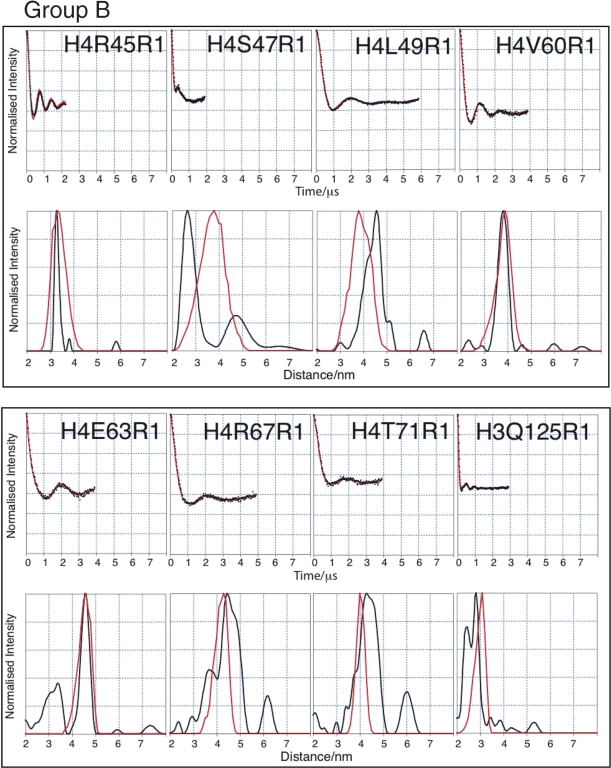
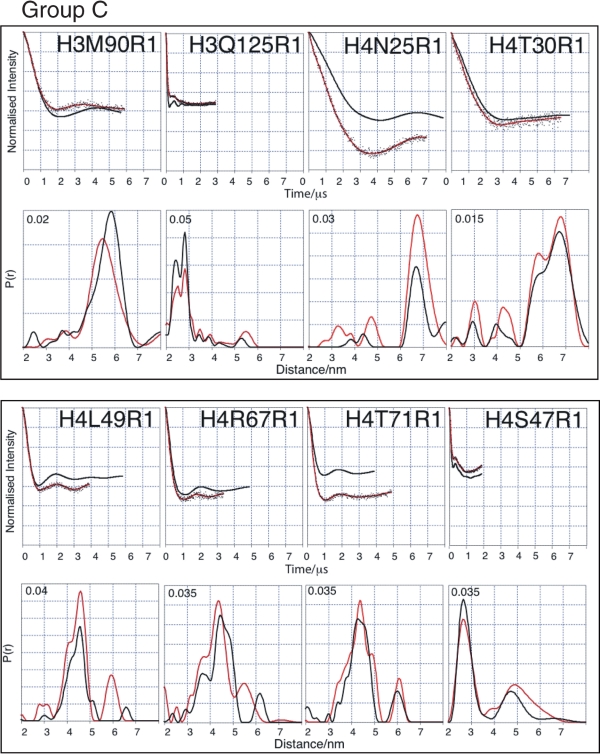
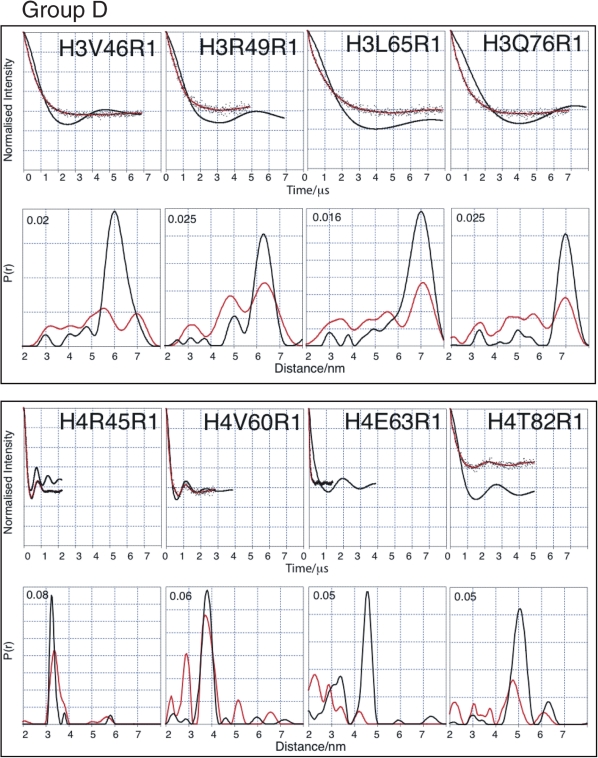
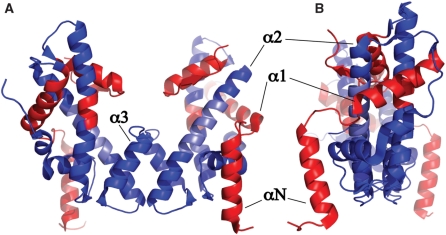
The (H3-H4)(2) histone tetramer forms the central core of nucleosomes and, as such, plays a prominent role in assembly, disassembly and positioning of nucleosomes. Despite its fundamental role in chromatin, the tetramer has received little structural investigation. Here, through the use of pulsed electron-electron double resonance spectroscopy coupled with site-directed spin labelling, we survey the structure of the tetramer in solution. We find that tetramer is structurally more heterogeneous on its own than when sequestered in the octamer or nucleosome. In particular, while the central region including the H3-H3' interface retains a structure similar to that observed in nucleosomes, other regions such as the H3 alphaN helix display increased structural heterogeneity. Flexibility of the H3 alphaN helix in the free tetramer also illustrates the potential for post-translational modifications to alter the structure of this region and mediate interactions with histone chaperones. The approach described here promises to prove a powerful system for investigating the structure of additional assemblies of histones with other important factors in chromatin assembly/fluidity.


Figures

Figure 1.
Figure 1.
Known structure and spin labelling positions. (A) Stereo cartoon from the crystal structure (1.9 Å) of the histone octamer (PDB code 1TZY): H2A, H2B represented by transparent/grey colour; H3 by wheat; H4 by pale blue. Spin label positions indicated by blue (H4) or red (H3) spheres. (B) H3 labelling positions (red) on monomer. (C) H4-labelling positions (blue) monomer. (D) Histone fold (colour coded). (E) H3 and H4 amino acid sequences with labelling sites coloured red and blue, respectively. Helices indicated by coloured boxes and β-sheets by red arrowheads.
Figure 2.
Figure 2.
PELDOR data from the histone octamer for Group A. Results derived from label positions >4 nm apart based on predicted Cα-Cα distance. For each mutant two graphs of data are shown. Top graphs: Background corrected echo oscillations (black), Tikhonov fit (red). Bottom graphs: Tikhonov regularization-derived distance distributions (black), simulated distributions (red).
Figure 3.
Figure 3.
PELDOR data from the histone octamer for Group B. Results derived from label positions <4 nm apart based on predicted Cα-Cα distance. For each mutant two graphs of data are shown. Top graphs: Background corrected echo oscillations (black), Tikhonov fit (red). Bottom graphs: Tikhonov regularization-derived distance distributions (black), simulated distributions (red).
Figure 4.
Figure 4.
Comparison of tetramer and octamer PELDOR data in Group C (minor differences between octamer and tetramer measurements). For each mutant two graphs of data are shown. Top graphs: Tikhonov-derived fit to octamer PELDOR data (black), background-corrected echo oscillation from tetramer (black dots) and Tikhonov-derived fit to tetramer (red). Bottom graphs: Tikhonov regularization-derived distance distributions octamer (black), tetramer (red).
Figure 5.
Figure 5.
Comparison of tetramer and octamer PELDOR data in Group D (major differences between octamer and tetramer measurements). For each mutant two graphs of data are shown. Top graphs: Tikhonov-derived fit to octamer PELDOR data (black), background-corrected echo oscillation from tetramer (black dots) and Tikhonov-derived fit to tetramer (red). Bottom graphs: Tikhonov regularization-derived distance distributions octamer (black), tetramer (red).
Figure 6.
Figure 6.
Cartoon view of H3/H4 histone tetramer coloured as per histone core octamer structure. Very similar regions (blue), very dissimilar or heterogeneous regions (red), region with lack of reporting data (light blue) are depicted. The helices of histone H3 are labelled for clarity. (A) front view showing H3-H3′ interface at centre. (B) side view.

Similar articles

Cited by

References

    1. Luger K, Rechsteiner TJ, Flaus AJ, Waye MM, Richmond TJ. Characterization of nucleosome core particles containing histone proteins made in bacteria. J. Mol. Biol. 1997;272:301–311. - PubMed
    1. Jorcano JL, Ruiz-Carrillo A. H3.H4 tetramer directs DNA and core histone octamer assembly in the nucleosome core particle. Biochemistry. 1979;18:768–774. - PubMed
    1. Polach KJ, Widom J. Mechanism of protein access to specific DNA-sequences in chromatin – a dynamic equilibrium-model for gene-regulation. J. Mol. Biol. 1995;254:130–149. - PubMed
    1. Kimura H, Cook PR. Kinetics of core histones in living human cells: little exchange of H3 and H4 and some rapid exchange of H2B. J. Cell Biol. 2001;153:1341–1353. - PMC - PubMed
    1. Thiriet C, Hayes JJ. Replication-independent core histone dynamics at transcriptionally active loci in vivo. Genes Dev. 2005;19:677–682. - PMC - PubMed

Publication types