

Probabilistic model of microbial cell growth, division, and mortality
- PMID: 19915038
- PMCID: PMC2798664
- DOI: 10.1128/AEM.01527-09
Probabilistic model of microbial cell growth, division, and mortality
Abstract
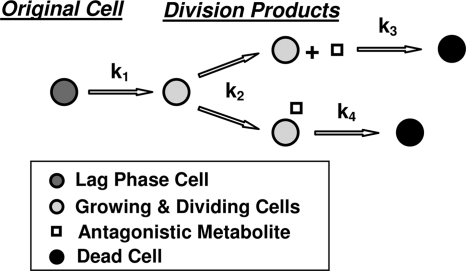
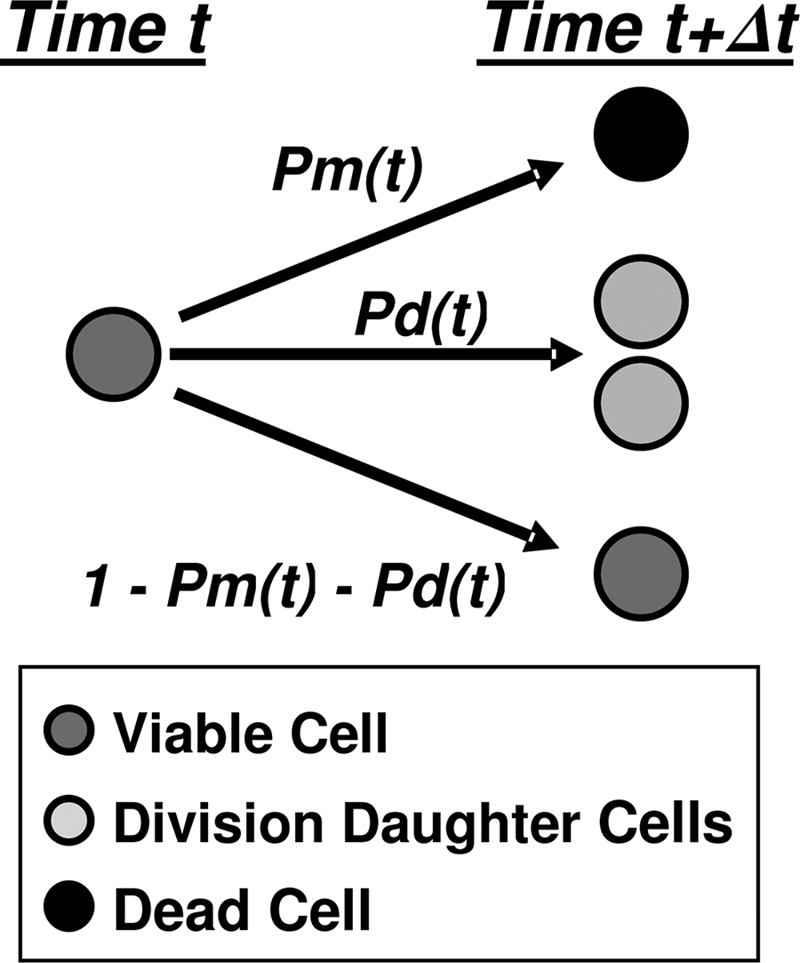
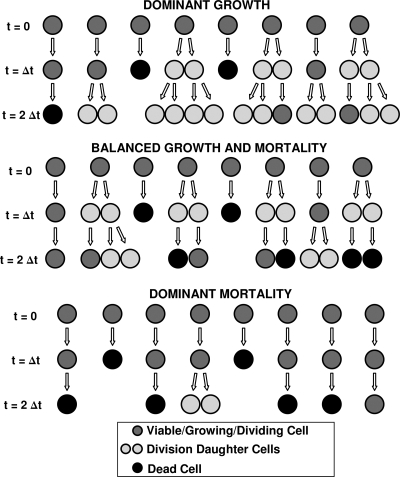
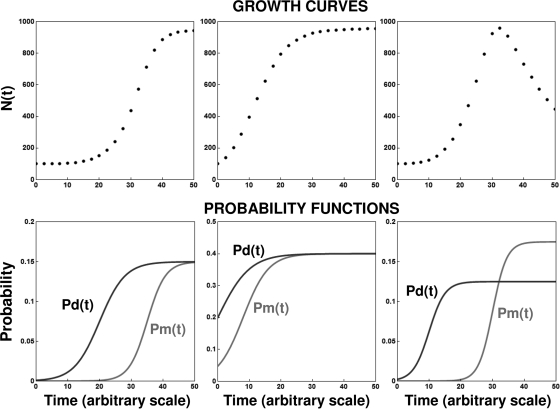
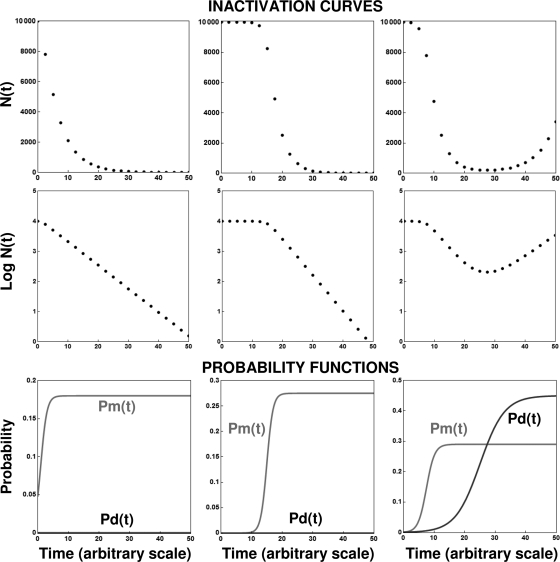
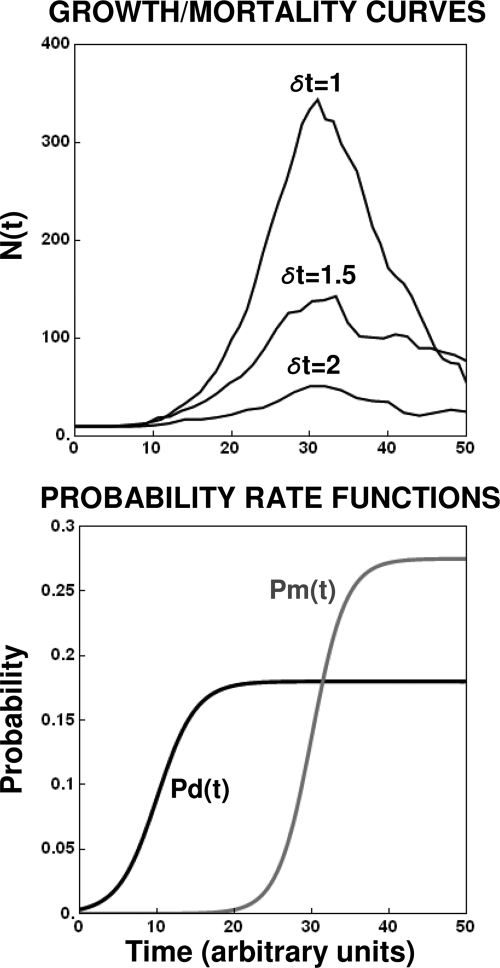
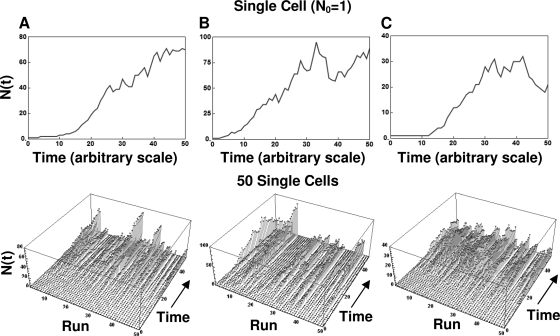
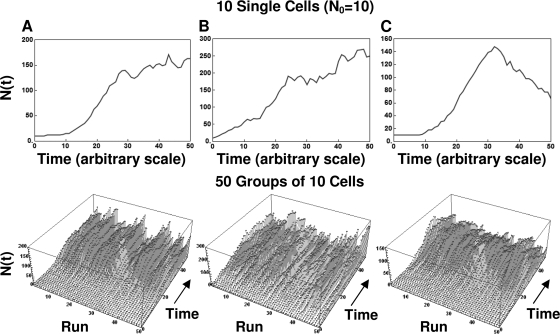
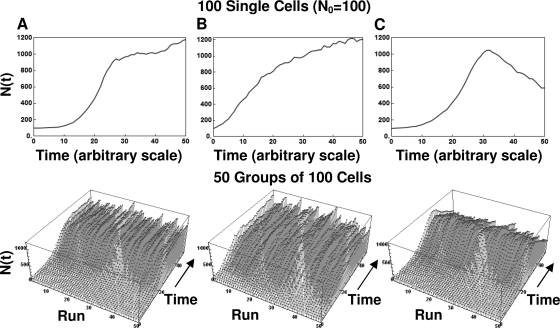
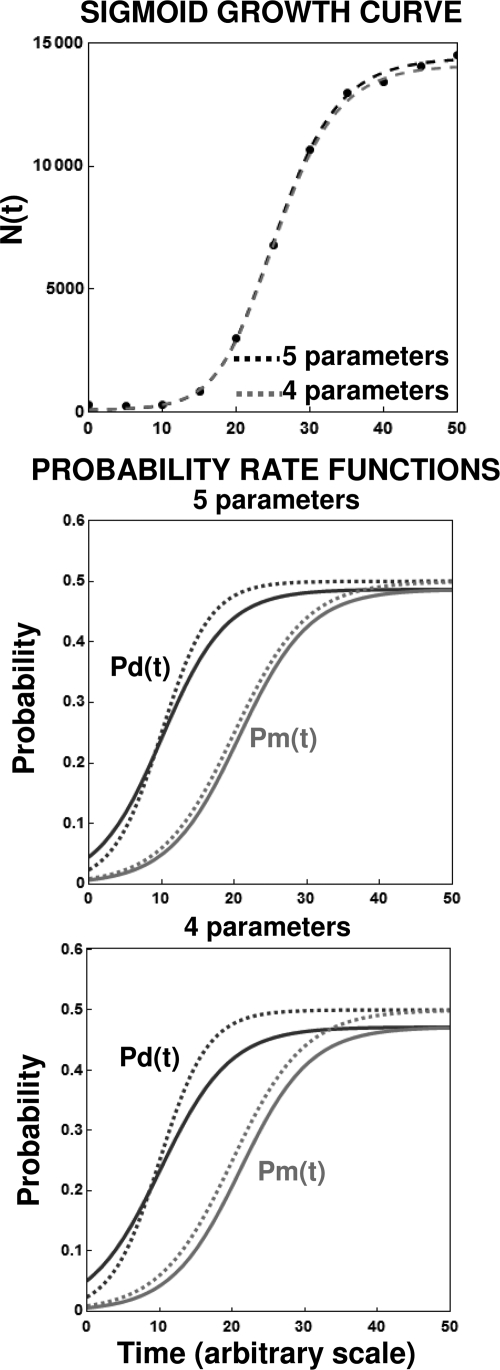
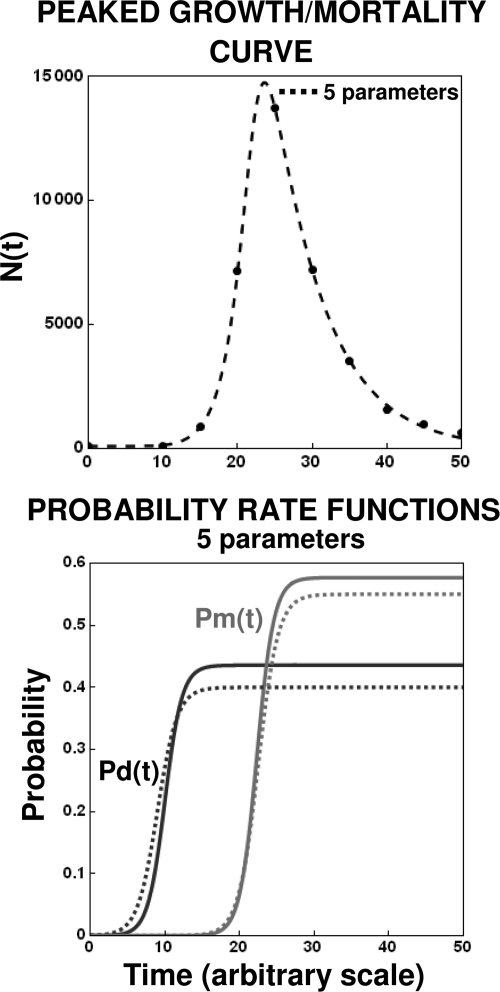
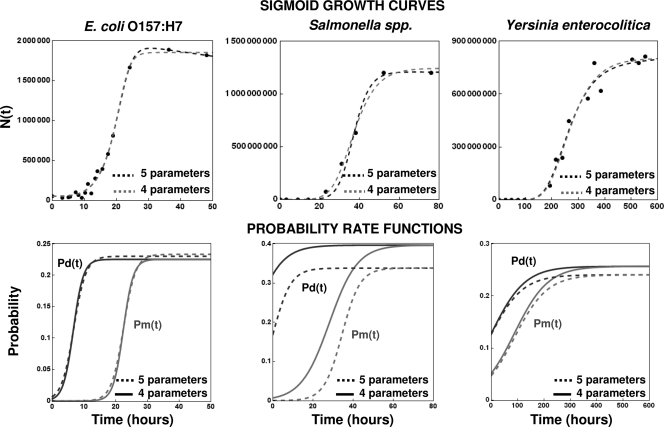
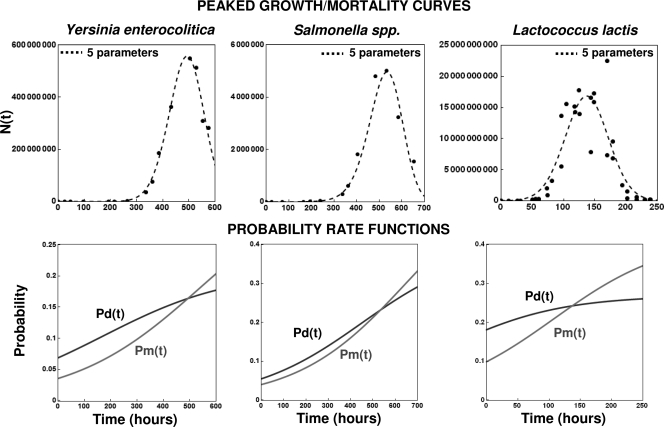
After a short time interval of length deltat during microbial growth, an individual cell can be found to be divided with probability Pd(t)deltat, dead with probability Pm(t)deltat, or alive but undivided with the probability 1-[Pd(t)+Pm(t)]deltat, where t is time, Pd(t) expresses the probability of division for an individual cell per unit of time, and Pm(t) expresses the probability of mortality per unit of time. These probabilities may change with the state of the population and the habitat's properties and are therefore functions of time. This scenario translates into a model that is presented in stochastic and deterministic versions. The first, a stochastic process model, monitors the fates of individual cells and determines cell numbers. It is particularly suitable for small populations such as those that may exist in the case of casual contamination of a food by a pathogen. The second, which can be regarded as a large-population limit of the stochastic model, is a continuous mathematical expression that describes the population's size as a function of time. It is suitable for large microbial populations such as those present in unprocessed foods. Exponential or logistic growth with or without lag, inactivation with or without a "shoulder," and transitions between growth and inactivation are all manifestations of the underlying probability structure of the model. With temperature-dependent parameters, the model can be used to simulate nonisothermal growth and inactivation patterns. The same concept applies to other factors that promote or inhibit microorganisms, such as pH and the presence of antimicrobials, etc. With Pd(t) and Pm(t) in the form of logistic functions, the model can simulate all commonly observed growth/mortality patterns. Estimates of the changing probability parameters can be obtained with both the stochastic and deterministic versions of the model, as demonstrated with simulated data.
Figures
Similar articles
-
Stochastic and deterministic model of microbial heat inactivation.J Food Sci. 2010 Mar;75(2):R59-70. doi: 10.1111/j.1750-3841.2009.01494.x. J Food Sci. 2010. PMID: 20492253
-
Microbial growth curves: what the models tell us and what they cannot.Crit Rev Food Sci Nutr. 2011 Dec;51(10):917-45. doi: 10.1080/10408398.2011.570463. Crit Rev Food Sci Nutr. 2011. PMID: 21955092 Review.
-
Stochastic evaluation of Salmonella enterica lethality during thermal inactivation.Int J Food Microbiol. 2018 Nov 20;285:129-135. doi: 10.1016/j.ijfoodmicro.2018.08.006. Epub 2018 Aug 8. Int J Food Microbiol. 2018. PMID: 30118951
-
On modeling and simulating transitions between microbial growth and inactivation or vice versa.Int J Food Microbiol. 2006 Apr 15;108(1):22-35. doi: 10.1016/j.ijfoodmicro.2005.10.011. Epub 2006 Jan 5. Int J Food Microbiol. 2006. PMID: 16403587
-
Cell division theory and individual-based modeling of microbial lag: part I. The theory of cell division.Int J Food Microbiol. 2005 Jun 15;101(3):303-18. doi: 10.1016/j.ijfoodmicro.2004.11.016. Int J Food Microbiol. 2005. PMID: 15925713 Review.
Cited by
-
Modeling of fungal and bacterial spore germination under static and dynamic conditions.Appl Environ Microbiol. 2013 Nov;79(21):6765-75. doi: 10.1128/AEM.02521-13. Epub 2013 Aug 30. Appl Environ Microbiol. 2013. PMID: 23995922 Free PMC article.
-
Microbial Interaction Network Inference in Microfluidic Droplets.Cell Syst. 2019 Sep 25;9(3):229-242.e4. doi: 10.1016/j.cels.2019.06.008. Epub 2019 Sep 4. Cell Syst. 2019. PMID: 31494089 Free PMC article.
-
Microbial Dose-Response Curves and Disinfection Efficacy Models Revisited.Food Eng Rev. 2021;13(2):305-321. doi: 10.1007/s12393-020-09249-6. Epub 2020 Aug 28. Food Eng Rev. 2021. PMID: 40477138 Free PMC article. Review.
-
Age-dependent stochastic models for understanding population fluctuations in continuously cultured cells.J R Soc Interface. 2013 Jun 12;10(85):20130325. doi: 10.1098/rsif.2013.0325. Print 2013 Aug 6. J R Soc Interface. 2013. PMID: 23760298 Free PMC article.
-
Evaluation of a stochastic inactivation model for heat-activated spores of Bacillus spp.Appl Environ Microbiol. 2010 Jul;76(13):4402-12. doi: 10.1128/AEM.02976-09. Epub 2010 May 7. Appl Environ Microbiol. 2010. PMID: 20453137 Free PMC article.
References
-
- Balaban, N. Q., J. Merrin, R. Chait, L. Kowalik, and S. Leiber. 2004. Bacterial persistence as a phenotypic switch. Science 305:1622-1625. - PubMed
-
- Baranyi, J. 2002. Stochastic modelling of bacterial lag phase. Int. J. Food Microbiol. 73:203-206. - PubMed
-
- Baranyi, J., C. Pin, and T. Ross. 1999. Validating and comparing predictive models. Int. J. Food Microbiol. 48:159-166. - PubMed
-
- Baranyi, J. 1998. Comparison of stochastic and deterministic concepts of bacterial lag. J. Theor. Biol. 192:403-408. - PubMed
-
- Baranyi, J., and T. A. Roberts. 1994. A dynamic approach to predicting bacterial growth in food. Int. J. Food Microbiol. 23:277-294. - PubMed
MeSH terms
LinkOut - more resources
Full Text Sources
