. 2009 Dec 1;183(11):7286-96.
doi: 10.4049/jimmunol.0902490. Epub 2009 Nov 13.

T cell intrinsic heterodimeric complexes between HVEM and BTLA determine receptivity to the surrounding microenvironment

Affiliations

T cell intrinsic heterodimeric complexes between HVEM and BTLA determine receptivity to the surrounding microenvironment

Timothy C Cheung et al. J Immunol. .

Abstract

The inhibitory cosignaling pathway formed between the TNF receptor herpesvirus entry mediator (HVEM, TNFRSF14) and the Ig superfamily members, B and T lymphocyte attenuator (BTLA) and CD160, limits the activation of T cells. However, BTLA and CD160 can also serve as activating ligands for HVEM when presented in trans by adjacent cells, thus forming a bidirectional signaling pathway. BTLA and CD160 can directly activate the HVEM-dependent NF-kappaB RelA transcriptional complex raising the question of how NF-kappaB activation is repressed in naive T cells. In this study, we show BTLA interacts with HVEM in cis, forming a heterodimeric complex in naive T cells that inhibits HVEM-dependent NF-kappaB activation. The cis-interaction between HVEM and BTLA is the predominant form expressed on the surface of naive human and mouse T cells. The BTLA ectodomain acts as a competitive inhibitor blocking BTLA and CD160 from binding in trans to HVEM and initiating NF-kappaB activation. The TNF-related ligand, LIGHT (homologous to lymphotoxins, exhibits inducible expression, and competes with HSV glycoprotein D for HVEM, a receptor expressed by T lymphocytes, or TNFSF14) binds HVEM in the cis-complex, but NF-kappaB activation was attenuated, suggesting BTLA prevents oligomerization of HVEM in the cis-complex. Genetic deletion of BTLA or pharmacologic disruption of the HVEM-BTLA cis-complex in T cells promoted HVEM activation in trans. Interestingly, herpes simplex virus envelope glycoprotein D formed a cis-complex with HVEM, yet surprisingly, promoted the activation NF-kappaB RelA. We suggest that the HVEM-BTLA cis-complex competitively inhibits HVEM activation by ligands expressed in the surrounding microenvironment, thus helping maintain T cells in the naive state.


Conflict of interest statement

Disclosures

The authors have no financial conflict of interest.

Figures
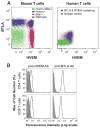
FIGURE 1
FIGURE 1
Coexpression of HVEM and BTLA in T cells. A, Coexpression analysis of HVEM and BTLA in naive T cells. T cells enriched from naive C57BL/6 spleen (left) and human blood (right) were identified with anti-CD3 and analyzed by flow cytometry. T cells isolated from splenocytes of Hvem−/−, Btla−/−, and Hvem−/−Btla−/− mice were used background staining (left) and Ig isotype proteins were used as negative control for the staining of human T cells (right). This profile for human T cells was observed in multiple donors; the staining profile for mouse T cells was conducted four or more times. B, HVEM and BTLA expression by naive CD4+ and CD8+ mouse T cells. T cells enriched from C57BL/6 spleen (open histogram) and Hvem−/−Btla−/− spleen (closed histogram) were stained for CD3, CD4, CD8, and HVEM (left) or BTLA (right) and analyzed by flow cytometry.
FIGURE 2
FIGURE 2
cis-interaction between HVEM and BTLA. A, Coimmunoprecipitation of HVEM and BTLA. 293T cells were transfected with HVEM (Flag tagged) and BTLA, or individually with expression plasmids. HVEM was isolated by immunoprecipitation using anti-Flag mAb (M2) and Western blotted to visualize BTLA with anti-human BTLA mAb (J168) (lane 4, top) and HVEM with biotinylated mouse anti-human HVEM (lane 4, bottom). 293T cells individually transfected with HVEM or BTLA were mixed at 1:1 ratio, centrifuged to establish contact, incubated for 30 min and subjected to immunoprecipitation as above (lane 3). Recombinant HVEM-Fc and BTLA-Fc were used as positive controls (lanes 1 and 2). Mouse IgG was used as isotype control for immunoprecipitation (lane 5). B, Whole cell extract was prepared from the mouse T cell hybridoma and the extract precleared (PC) with protein G Sepharose (lane 2). Endogenous BTLA-HVEM complex was isolated by immunoprecipitation using mouse anti-mBTLA mAb (6F7 clone, lane 3) and Western blotted to visualize HVEM with goat anti-mHVEM Ab. HVEM-Fc (50 ng) was used as positive control (lane 1). This experiment was conducted twice. C, Schema of the FRET system using HVEM-CFP (donor fluorophore) and BTLA-DsRed (acceptor fluorophore) to detect HVEM-BTLA cis-interaction. 293T cells were transfected individually or cotransfected with these fluorophores. Fluorescence was detected at the FRET channel with the detection window at 564–606 nm using a BD LSRII flow cytometry system. D, Subcellular localization of HVEM-CFP and BTLA-DsRed detected by confocal microscopy. HVEM-CFP and BTLA-DsRed expressing 293T cells were visualized using an Kr-Ar laser with the laser line set at 488 nm, and the fluorescence is colored in cyan for CFP and in red for DsRed. Cells expressing CFP or DsRed 293T cells were used as controls (bottom). E, Assessment of the cis-association of HVEM and BTLA by FRET assay. HVEM-CFP and BTLA-DsRed coexpressing cells, HVEM-CFP cells, and BTLA-DsRed cells were detected at the CFP channel (excitation at 405 nm, emission at 425–475 nm), DsRed channel (excitation at 488 nm, emission at 562–588 nm), and FRET channel (excitation at 405 nm, emission at 564–606 nm). HVEM-CFP and BTLA-DsRed coexpressing cells (blue), HVEM-CFP cells (cyan), and BTLA-DsRed cells (red). Note that at similar levels of CFP and DsRed expression with reference to the HVEM-CFP and BTLA-DsRed coexpressing cells (top left), there was minimal CFP spectral overlap and DsRed coexcitation detected in the FRET channel (bottom left). E, right panel, overlay of the FRET channel. This result is representative of more than four independent experiments.
FIGURE 3
FIGURE 3
HVEM-BTLA cis-complex inhibits trans-interactions. A, left, BTLA and HVEM coexpressing 293T cells (293T-BTLA-HVEM) or BTLA expressing 293T cells (293T-BTLA) were prepared by transfection of HVEM-pcDNA3.1 and/or BTLA-GFP-pMIG. 293T-BTLA and 293T-BTLA-HVEM were stained with rat anti-BTLA mAb (5 μg/ml; 6F4) or goat anti-HVEM Ab (25 μg/ml). Mock transfected 293T cells were used as negative controls (filled histogram). Right, Saturation binding assay for HVEM-Fc binding to 293T-BTLA or 293T-BTLA-HVEM. Graded concentrations of HVEM-Fc were added to the cells in binding buffer (PBS with 2% FBS) for 45 min, washed, and stained with RPE conjugated goat anti-human IgG Fcγ. 293T-BTLA and 293T-BTLA-HVEM that have a similar level of BTLA expression (based on the GFP expression) were used for the assessment HVEM-Fc binding (Fig. 3A, right). B, Staining of purified mouse T cells with mBTLA-Fc or anti-BTLA (6F7) and anti-HVEM (LH1) Abs. Splenic T cells isolated from Hvem−/−Btla−/− (filled histogram), Btla−/−, Hvem−/− and wild-type mice were stained and analyzed by flow cytometry. C, BTLA binding site on HVEM in cis and trans. Top, Flow cytometric staining of 293T-HVEM, 293T-HVEM-Y61F, and 293T-HVEM-Y61A with goat anti-HVEM Ab (10 μg/ml) (unfilled histogram) or mock transfected 293T cells (filled) or BTLA-Fc (25 μg/ml) (bottom) to the HVEM mutants. D, Competition of cis- and trans-interaction between wild type HVEM, HVEM-Y61A, and BTLA. BTLA and HVEM-Y61A mutant were cotransfected into 293T cells (293T-BTLA-HVEM-Y61A). Left, Flow cytometric staining of 293T-BTLA-HVEM cells with rat anti-BTLA mAb (6F4 clone, 5 μg/ml, unfilled histogram) or goat anti-HVEM Ab (10 μg/ml, unfilled histogram) or mock transfected 293T cells (filled histogram). Right, Saturation binding analysis for HVEM-Fc binding to 293T-BTLA-HVEM-Y61A. Graded concentrations HVEM-Fc were added to the cells in binding buffer, and the saturation binding assay was carried as in A. E, Competition of cis- and trans-interaction between wild-type HVEM, HVEM-Y61F and BTLA. BTLA and HVEM-Y61F mutant were cotransfected into 293T cells (293T-BTLA-HVEM-Y61F). Cell surface staining for BTLA and HVEM was performed as in D, left. Saturation binding assay for HVEM-Fc binding to 293T-BTLA-HVEM-Y61F was conducted as in D, right. These results are the representative of a minimum of two independent experiments.
FIGURE 4
FIGURE 4
HVEM-BTLA cis-complex inhibits LIGHT-mediated HVEM signaling. A, Schematic illustration of soluble LIGHT (LIGHTt66) binding to HVEM-BTLA cis-association complex (left). Binding of LIGHTt66 to HVEM and BTLA coexpressing 293T cells (right). 293T cells stably expressing HVEM (293T-HVEM), and 293T cells stably coexpressing HVEM and BTLA (293T-HVEM-BTLA) with equivalent HVEM expression were incubated with soluble Flag tagged LIGHTt66 (10 μg/ml) and detected with anti-FLAG Ab. Untransfected 293T cells were used as a negative control. B, The HVEM-BTLA cis-interaction alters HVEM signaling. NF-κB dependent luciferase reporter vector was transfected into 293T-HVEM and 293T-HVEM-BTLA coexpressing cells. LIGHT expressing EL4 cells (EL4-LIGHT) were cocultured with 239T-HVEM cells for 24 h and then assessed for luciferase activity in cell lysates. Error bars indicate the SE generated from the average of two data points from a representative experiment repeated at least twice. C, Dose response of EL4-LIGHT cells or soluble LIGHTt66 were incubated at the indicated ratio or concentration with 293T-HVEM (left) or 293T-HVEM-BTLA cells (right) and HVEM signaling was assessed using luciferase reporter assay as in B. D, BTLA expressing normal human dermal fibroblasts (NHDF-BTLA) were incubated with mouse anti-human BTLA mAb (J168 clone) and HVEM-Fc binding assessed on fibroblasts by flow cytometry. E, Disruption of HVEM-BTLA cis-interaction with antagonist anti-BTLA mAb (J168). FRET analysis was performed with HVEM-CFP and BTLA-DsRed coexpressing 293T cells (as in Fig. 2E) in the presence of anti-BTLA mAb (J168) for 1 h at room temperature. F, EL4-LIGHT cells were cocultured with 293T-HVEM-BTLA cells with or without anti-BTLA (J168). LIGHT-mediated HVEM signaling was detected with NF-κB luciferase reporter assay.
FIGURE 5
FIGURE 5
Inhibition of NF-κB activation by HVEM through BTLA and CD160 cis-complexes and activation by herpesvirus gD. A, Recruitment of TRAF molecules to HVEM in the context of BTLA-mediated HVEM signaling. 293T-LTβR (lane 3), 293T (lane 4), 293T-HVEM-BTLA cells (cis) (lane 5), as well as 293T-HVEM-Flag and 293T-BTLA (trans) (lane 6) were lysed and immunoprecipitated with anti-Flag (M2) or with anti-LTβR and Western blotted for TRAF2 and TRAF3 (lanes 3 and 6). 293T-HVEM and 293T-BTLA cells were cocultured at 1:1 ratio and incubated for 30 min before lysis (lane 6). HVEM-Fc was used as a positive control (lane 1) and the M2 mAb were used as a negative control (lane 2). B, Inhibition of HVEM trans-activation by HVEM-BTLAΔcyto cis-complex. NF-κB dependent luciferase reporter was transfected into 293T-HVEM, 293T-HVEM-BTLA, and 293T-HVEM-BTLAΔcyto coexpressing cells. BTLA-Fc (5 μg/ml) and anti-Fcγ Ab (1:1 ratio) were incubated with the transfected cells for 24 h and then assessed for luciferase activity in cell lysates. Error bars indicate the SE generated from the average of two data points from a representative experiment repeated at least twice. C, HVEM-BTLA cis-interaction inhibits CD160-mediated HVEM signaling. EL4-CD160 cells were cocultured with 293T-HVEM, 293T-HVEM-CD160, or 293T-HVEM-BTLA cells that were transfected with NF-κB reporter plasmid. Luciferase activities were measured after 24 h. D, Saturation binding assay for gD-Fc binding to 293T-HVEM or 293T-HVEM-BTLA. 293T cells were transfected with HVEM and/or BTLA expression plasmids. Graded concentrations of gD-Fc were added to the transfected cells in binding buffer (PBS with 2% FCS) for 45 min, washed, and stained with PE conjugated anti-rabbit IgG (left). Saturation binding assay for BTLA-Fc binding to 293T-HVEM or 293T-HVEM-gD. 293T cells were transfected with HVEM and/or gD expression plasmids. Graded concentrations of BTLA-Fc were added to the transfected cells in binding buffer. Binding analyses were conducted as in the left panel. RPE conjugated goat anti-human IgG Fcγ was used as secondary Ab (right). E, HVEM-gD cis-interaction alters LIGHT-mediated HVEM signaling. NF-κB dependent luciferase reporter vector was transfected into 293T-HVEM, 293T-gD, and 293T-HVEM-gD coexpressing cells. LIGHT expressing EL4 cells (EL4-LIGHT) were cocultured with the prepared cells for 24 h and then assessed for luciferase activity in cell lysates. EL4 cells were used as negative controls (left). Error bars indicate the SE generated from the average of two data points from a representative experiment repeated at least twice. The level of NF-κB activation mediated by EL4-LIGHT was determined by the equation as follows: (EL4-LIGHT-mediated RLU/EL4-mediated RLU) – 1. For comparison, the level of EL4-LIGHT-mediated NF-κB activation on 293T-HVEM cells was set at 100 U (right). F, HVEM-gD cis-interaction alters gD-mediated HVEM signaling. Transfected cells were prepared as in E. gD-Fc (20 μg/ml) was added to the cells for 24 h and then luciferase activity was assessed in cell lysates. Rabbit IgG (20 μg/ml) were used as negative control (left). Error bars indicate the SE generated from the average of two data points from a representative experiment repeated at least twice. The level of NF-κB activation mediated by gD was determined by the equation above (right).
FIGURE 6
FIGURE 6
Effector T cell survival requires HVEM and BTLA. A, BTLA-mediated HVEM trans-signaling in T cell hybridoma cells. Immunocytochemical staining for RelA translocation was performed on T cell hybridoma cells following incubation with PMA (50 ng/ml), BTLA-Fc (15 μg/ml), or the combination of antagonist anti-BTLA (6A6) Ab or non blocking anti-BTLA (6F7) Ab (20 μg/ml). B, Intrinsic HVEM and BTLA requirement for effector T cell survival. Cotransfer of cells were conducted with 5 × 10⁵ WT (CD45.2+) and 5 × 10⁵ Btla−/− or Hvem−/− (CD45.1+CD45.2+) naive T cells transferred into Rag−/−, Btla−/−Rag−/−, or Hvem−/−Rag−/− recipients. Mice were euthanized 3 wk posttransfer and analyzed by FACS for expression of the allelic markers as a percentage of the TCRβ+CD4+ T cells in the spleen of transferred animals (n = 3– 4 mice per group). This experiment is representative of three independent experiments using different congenic markers on the donor T cells.

Similar articles

Cited by

References

    1. Montgomery RI, Warner MS, Lum B, Spear PG. Herpes simplex virus 1 entry into cells mediated by a novel member of the TNF/NGF receptor family. Cell. 1996;87:427–436. - PubMed
    1. Sedy JR, Gavrieli M, Potter KG, Hurchla MA, Lindsley RC, Hildner K, Scheu S, Pfeffer K, Ware CF, Murphy TL, Murphy KM. B and T lymphocyte attenuator regulates T cell activation through interaction with herpesvirus entry mediator. Nat Immunol. 2005;6:90–98. - PubMed
    1. Gonzalez LC, Loyet KM, Calemine-Fenaux J, Chauhan V, Wranik B, Ouyang W, Eaton DL. A coreceptor interaction between the CD28 and TNF receptor family members B and T lymphocyte attenuator and herpesvirus entry mediator. Proc Natl Acad Sci USA. 2005;102:1116–1121. - PMC - PubMed
    1. Mauri DN, Ebner R, Montgomery RI, Kochel KD, Cheung TC, Yu GL, Ruben S, Murphy M, Eisenberg RJ, Cohen GH, et al. LIGHT, a new member of the TNF superfamily, and lymphotoxin α are ligands for herpesvirus entry mediator. Immunity. 1998;8:21–30. - PubMed
    1. Cai G, Anumanthan A, Brown JA, Greenfield EA, Zhu B, Freeman GJ. CD160 inhibits activation of human CD4+ T cells through interaction with herpesvirus entry mediator. Nat Immunol. 2008;9:176–185. - PubMed

Publication types

MeSH terms

Substances