. 2009 Dec 1;183(11):7234-43.
doi: 10.4049/jimmunol.0900088. Epub 2009 Nov 13.

SHP-2 expression negatively regulates NK cell function

Affiliations

SHP-2 expression negatively regulates NK cell function

Amanda K Purdy et al. J Immunol. .

Abstract

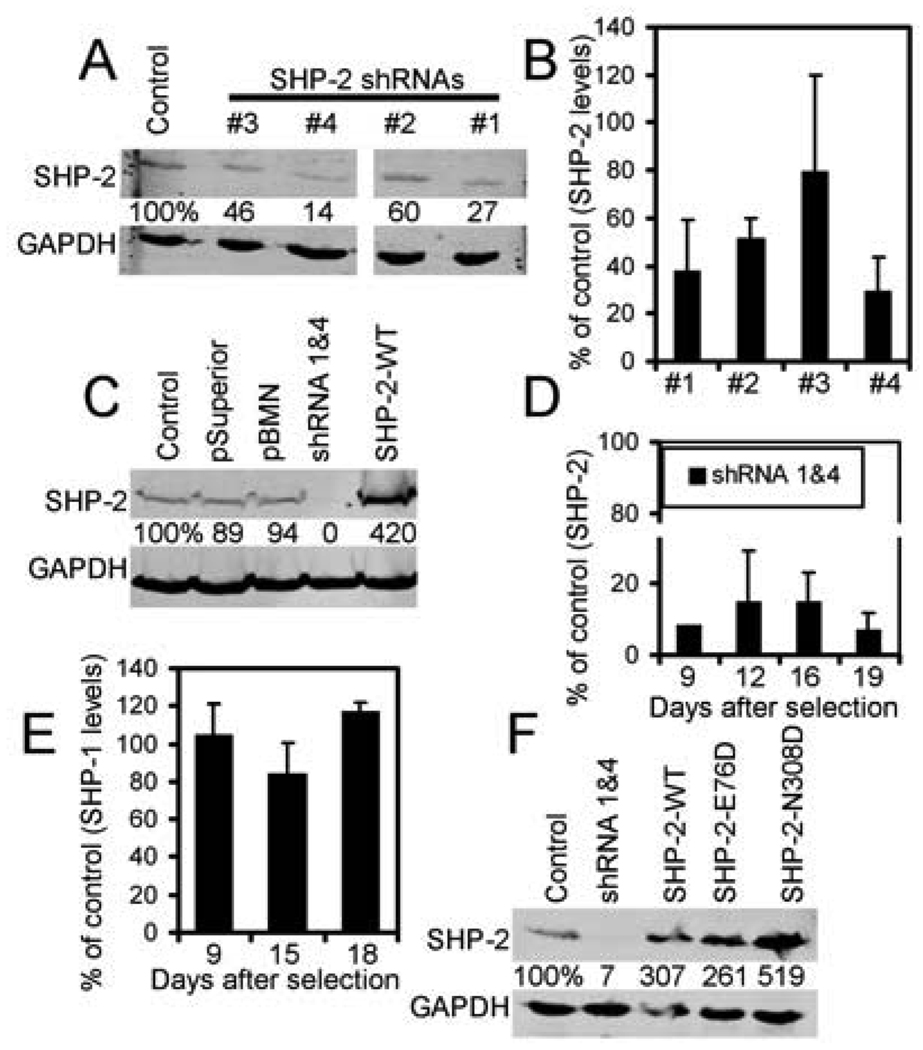
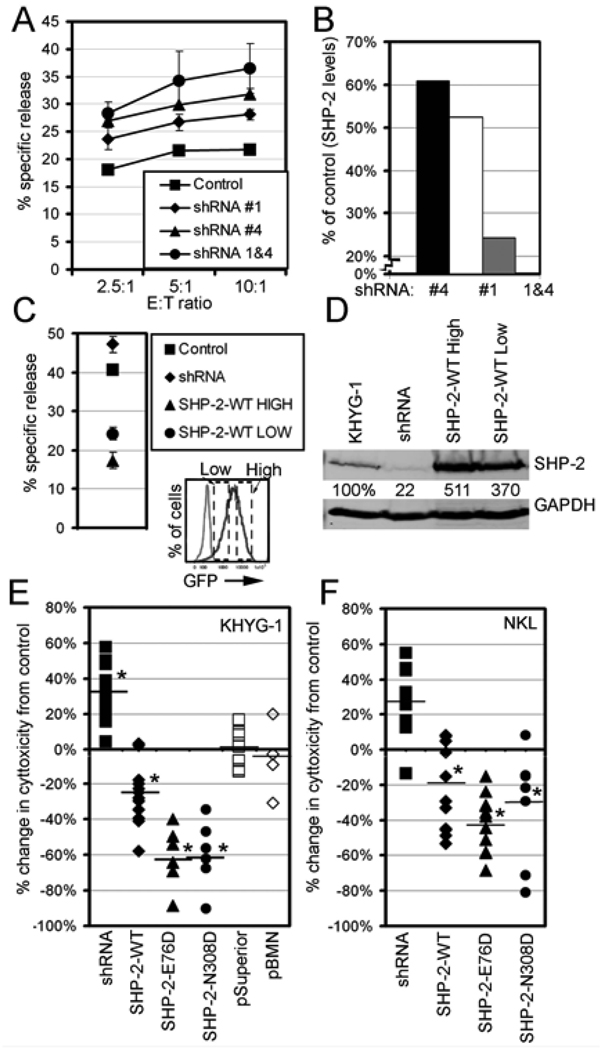
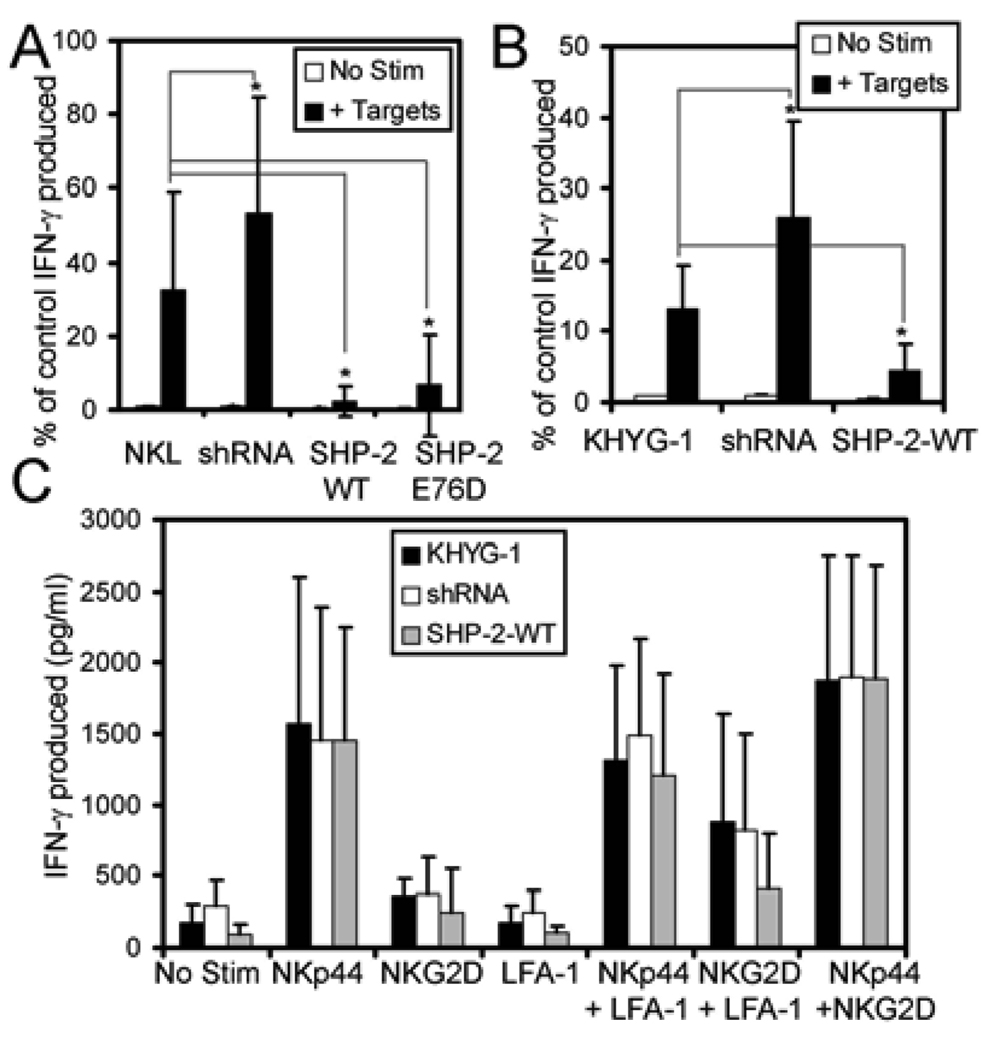
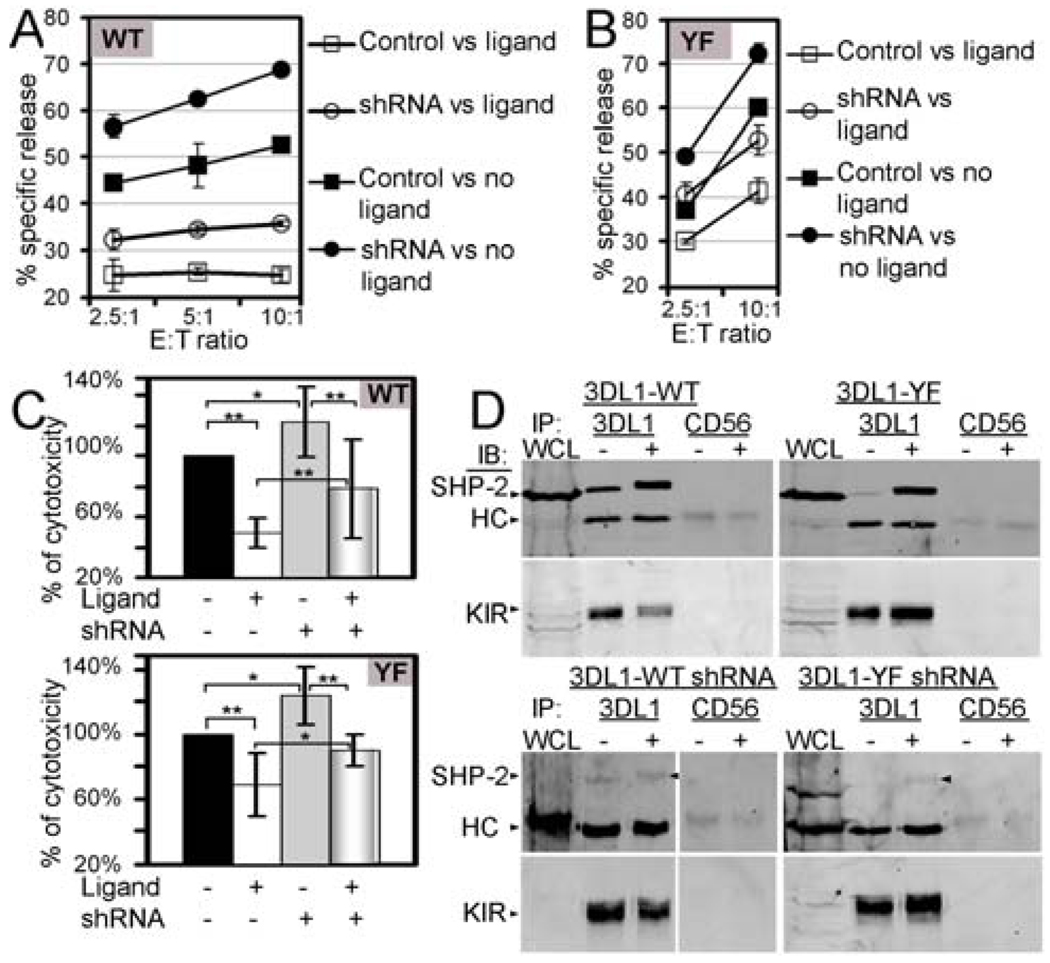
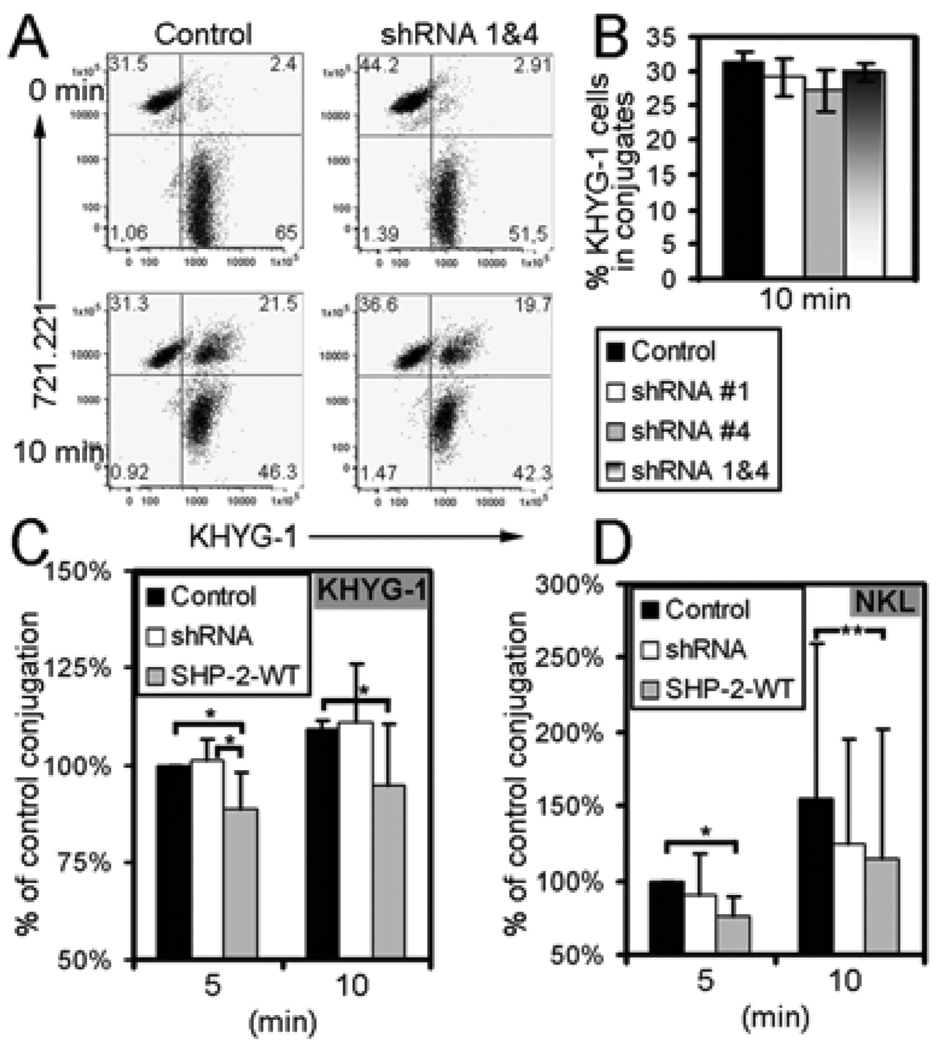
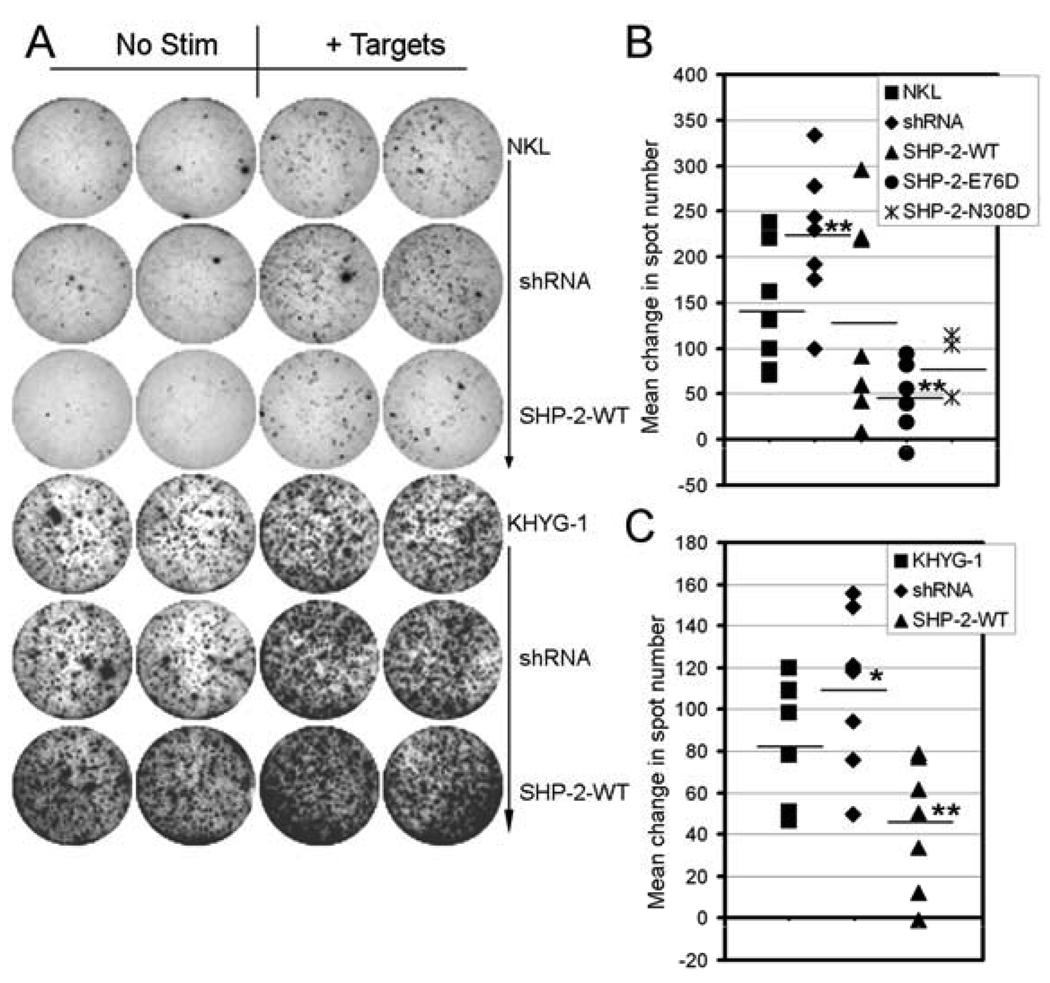
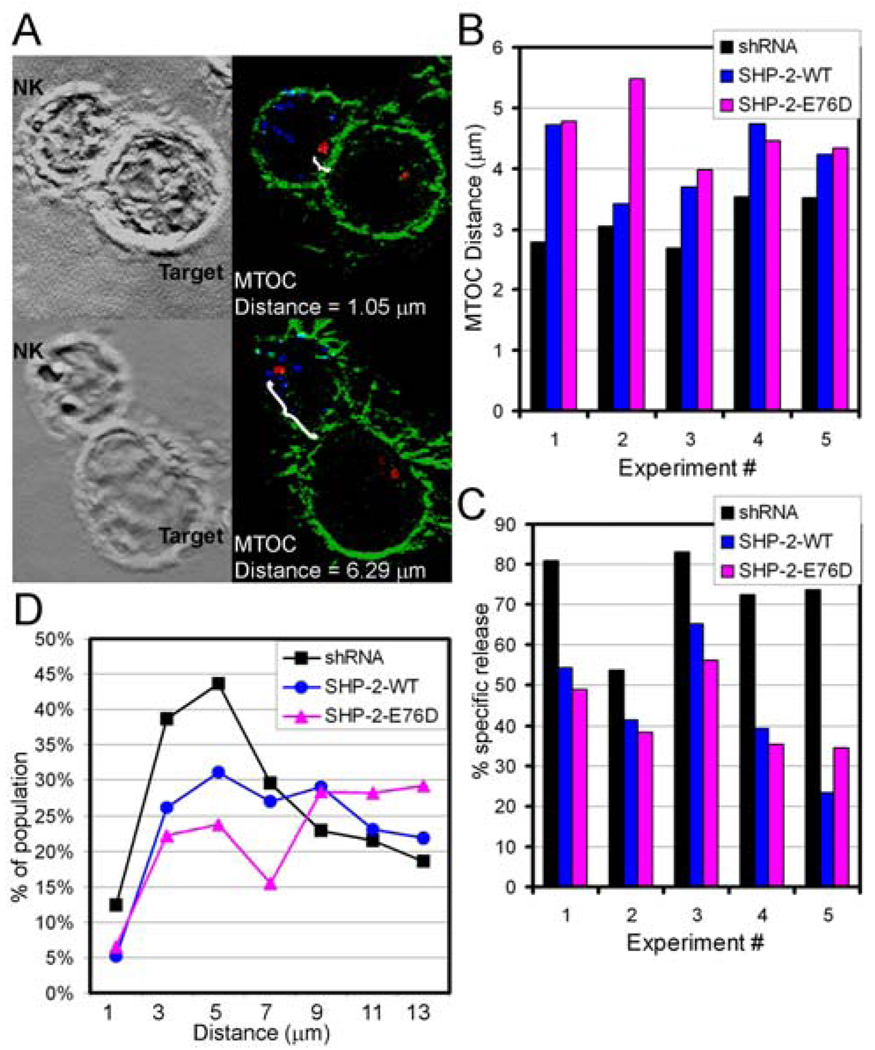
Src homology region 2-containing protein tyrosine phosphatase-2 (SHP-2) is required for full activation of Ras/ERK in many cytokine and growth factor receptor signaling pathways. In contrast, SHP-2 inhibits activation of human NK cells upon recruitment to killer cell Ig-like receptors (KIR). To determine how SHP-2 impacts NK cell activation in KIR-dependent or KIR-independent signaling pathways, we employed knockdown and overexpression strategies in NK-like cell lines and analyzed the consequences on functional responses. In response to stimulation with susceptible target cells, SHP-2-silenced NK cells had elevated cytolytic activity and IFN-gamma production, whereas cells overexpressing wild-type or gain-of-function mutants of SHP-2 exhibited dampened activities. Increased levels of SHP-2 expression over this range significantly suppressed microtubule organizing center polarization and granzyme B release in response to target cells. Interestingly, NK-target cell conjugation was only reduced by overexpressing SHP-2, but not potentiated in SHP-2-silenced cells, indicating that conjugation is not influenced by physiological levels of SHP-2 expression. KIR-dependent inhibition of cytotoxicity was unaffected by significant reductions in SHP-2 levels, presumably because KIR were still capable of recruiting the phosphatase under these limiting conditions. In contrast, the general suppressive effect of SHP-2 on cytotoxicity and cytokine release was much more sensitive to changes in cellular SHP-2 levels. In summary, our studies have identified a new, KIR-independent role for SHP-2 in dampening NK cell activation in response to tumor target cells in a concentration-dependent manner. This suppression of activation impacts microtubule organizing center-based cytoskeletal rearrangement and granule release.


Conflict of interest statement

Conflict of Interest Disclosure:

The authors declare no conflict of interest or financial interests.

Figures

Figure 1
Figure 1. SHP-2 protein levels are decreased in NK cells stably expressing SHP-2 shRNAs
A. SDS-protein extracts from KHYG-1 cells retrovirally transduced to express single SHP-2 shRNAs were immunoblotted with monoclonal anti-GAPDH and -SHP-2 antibodies. The degree of knockdown was determined by quantifying the ratio of SHP-2/GAPDH for SHP-2-silenced cells compared to untransduced cells (control set at 100%) to calculate the percentage of SHP-2 compared to control, as listed below each band. B. The mean ± SD of SHP2 levels remaining in KHYG-1 cells expressing SHP-2 shRNA #1, 2, 3 or 4 were quantified from multiple experiments as above. At least 4 samples from 2 separate transductions are compared for each shRNA. C. Impacts on the cellular levels of SHP-2 in KHYG-1 cells transduced with SHP-2 shRNAs 1&4, wildtype SHP-2 cDNA (SHP-2-WT), or empty pSuperior or pBMN vectors. The percentage of SHP-2 remaining compared to control was calculated as in panel A and is shown below each band. D. SHP-2 protein levels in KHYG-1 cells transduced to express shRNAs 1&4 were compared to untransduced cells 9–19 days after antibiotic selection (see Methods). The mean ± SD of SHP-2 level remaining as compared to control for each timepoint is shown (measured at least twice for each timepoint). E. SHP-1 protein levels were quantified by immunoblotting lysates of KHYG-1 cells transduced to express SHP-2 shRNAs 1&4. Untransduced cells were used as a control in which SHP-1 levels were set to 100%. SHP-1 levels 9–18 days after antibiotic selection are shown. Each bar represents the mean ± SD of at least 2 samples. F. Retroviral transduction of NKL cells with SHP-2 shRNAs 1&4 or SHP-2-WT or Noonan mutant cDNAs, decreased or increased total SHP-2 levels, respectively, as quantified in panel A.
Figure 2
Figure 2. SHP-2 negatively impacts cytolytic activity in NK cells
A. Untransduced (control) KHYG-1 cells or those transduced to express SHP-2 shRNA #1, 4 or 1&4 were compared in a direct cytotoxicity assay for their ability to lyse 721.221 target cells. The mean ± SD percentage of 51Cr released due to target cell lysis was quantified (% specific release) from triplicate samples at 3 different NK:target (E:T) cell ratios. The mean ± SD from one representative experiment of four separate experiments is shown. B. Quantified SHP-2 levels in cells used for Panel A were quantified as in Figure 1A. C. KHYG-1 cells overexpressing SHP-2-WT were sorted into high and low expressing subpopulations (see GFP+ sorting gates on the histogram) and compared to SHP-2-silenced and control cells in a direct cytotoxicity assay at 2.5:1 E:T ratio as in Panel A. Mean ± SD data are representative of three separate experiments. D. SHP-2 levels in cells used for Panel C were quantified as in Figure 1A. E. Cytolytic activity of KHYG-1 cells expressing SHP-2 shRNA (1&4), overexpressing wildtype or gain-of-function mutant SHP-2 (WT, E76D or N308D) or transduced with empty vector (pSuperior.retro.neo and pSuperior.retro.puro vectors or pBMN) was analyzed as in Panel A. The mean percent change in cytolytic activity (2.5:1 E:T ratio) as compared to control untransduced cells (0%) is shown as a horizontal bar. Each icon represents a mean of at least three samples from a separate experiment. An asterisk indicates a p value of ≤ 0.01. F. Mean percent change in cytolytic activity in transduced NKL cells as compared to untransduced cells was compared as in Panel E.
Figure 3
Figure 3. IFN-γ production is suppressed by elevated SHP-2 levels in NK cells stimulated with target cells, but not when stimulated with antibodies
A. 0.5×10⁶ untransduced control, SHP-2-silenced (co-expressing SHP-2 shRNAs 1&4) and SHP-2-overexpressing (WT or E76D) NKL cells were stimulated with 0.5×10⁶ 721.221 target cells (+ Targets) or medium alone (No Stim) for 24 hrs. Culture supernatants were harvested and the resulting IFN-γ produced was quantified by ELISA. Each value was then divided by the No Stim control sample (arbitrarily set to 1) to generate the % of control IFN-γ produced above background. The mean ± SD % IFN-γ production from five experiments is shown. An asterisk indicates a p value of ≤ 0.05. B. Target cell induced-IFN-γ production in KHYG-1 cells. 0.25–5×10⁶ KHYG-1 cells were stimulated with an equal number of 721.221 targets or medium alone for 24 hrs. Culture supernatants were harvested and the resulting IFN-γ produced (pg/ml) was quantified by ELISA and the % of control IFN-γ produced was calculated as above. The mean ± SD % of control IFN-γ production from three experiments is shown. An asterisk indicates a p value of ≤ 0.05. C. KHYG-1 cells were stimulated alone or in combination with plate-bound anti-NKp44, -NKG2D and -LFA-1 Abs for 24 hrs and the resulting IFN-γ produced was quantified by ELISA as in panel A. The mean ± SD of four separate experiments is shown. An asterisk indicates a p value of ≤ 0.05.
Figure 4
Figure 4. KIR-dependent inhibition of cytotoxicity is intact in SHP-2-silenced NK cells
Untransduced parent (control) and SHP-2-silenced (shRNA) KHYG-1 cells co-transduced to express wild-type (WT, A) or an ITIM mutant of KIR3DL1 (YF, B) were compared in a direct cytotoxicity assay for their ability to kill 721.221 target cells either expressing (ligand) or lacking (no ligand) the KIR3DL1 ligand, HLA-B51. The percentage of specific 51Cr released due to target cell lysis was quantified (% specific release) at 3 different NK:target cell ratios (E:T ratio). The mean ± SD of triplicate samples from one representative experiment of ten is shown. KIR levels were unaffected by SHP-2 shRNA expression (data not shown). C. Compilation of data from A and B. The mean ± SD of 2.5:1 E:T ratio data from 10 separate experiments are compared. For each experiment, the data were first divided by the ‘control vs. no ligand’ sample (arbitrarily set to 100%) to generate the % of cytotoxicity. A single asterisk indicates a p value of ≤ 0.05, while a double asterisk indicates a p value of ≤ 0.01 when comparing the bracketed conditions. D. Control and SHP-2-silenced (shRNA) KHYG-1 cells transduced to express KIR3DL1-WT or -YF were treated with prevanadate for 10 min, lysed with 1% Triton X-100, and immunoprecipitated (IP) with anti-CD56, and then with anti-KIR3DL1 (DX9) mAbs. IPs were separated by SDS-PAGE and immunoblotted (IB) for SHP-2 and KIR. Expression levels in whole cell lysates (WCL) are shown in the first lane of each blot. Heavy chain (HC) is also indicated.
Figure 5
Figure 5. Conjugation of NK cells to target cells is not consistently affected by changes in SHP-2 levels
A. The percentage of NK cells bound to targets was determined using a fixed cell conjugation assay (see Methods). KHYG-1 and 721.221 cells were mixed and pelleted briefly. Cells were incubated together for 0 or 10 min, fixed and the percentage of NK cells in conjugates was determined by FACS. A representative dot plot of FACS data comparing the incidence of conjugates between 721.221 cells (y-axis) and control (left panels) or SHP-2-silenced (shRNA 1&4; right panels) KHYG-1 cells (x-axis) at 0 and 10 min of incubation is shown. The percentage of cells within each quadrant is displayed and incidence of KHYG-1/721.221 conjugates appears in the upper right quadrant. B. Comparison of conjugation to 721.221 target cells between control KHYG-1 cells and those expressing SHP-2 shRNAs #1, 4 or 1 and 4 in combination in a fixed cell conjugation assay. The mean ± SD of triplicate samples from one representative experiment out of two is shown. C. The mean ± SD of the % of control NK cells in conjugates at 5–10 min for untransduced parent (control), SHP-2 silenced (shRNA) and SHP-2 overexpressing (SHP-2-WT) KHYG-1 (C) and NKL cells (D) are shown. For each experiment, the data were first divided by the % of NK cells conjugated for the 5 min untransduced parent NK cell sample (arbitrarily set to 100%) to generate the % of control conjugation. The mean was computed from 5 separate experiments for KHYG-1 and 7 separate experiments for NKL. A single asterisk indicates a p value of ≤ 0.05, while a double asterisk indicates a p value of ≤ 0.01.
Figure 6
Figure 6. Granzyme B release in response to target cells is diminished by SHP-2 expression in NK cells
A. Granzyme B release from representative control, SHP-2-silenced (shRNA 1&4) or SHP-2-WT-overexpressing NKL and KHYG-1 cells was determined by ELISPOT. 1×10⁴ NKL and 5×10³ KHYG-1 cells were incubated with medium alone (No Stim) or 721.221 target cells (+ Targets) at a 1:1 E:T ratio for 4–5 hrs and membranes in culture wells were developed by ELISPOT for granzyme B released. The brightness and contrast of the KHYG-1 samples was adjusted to help resolve the greater number and intensity of spots produced by the KHYG-1 cells as compared to NKL cells. B. Quantification of NKL cell data from experiments performed as in panel A. Spots were counted on an automated reader and the mean change in spot number after target cell stimulation is shown for control (NKL; untransduced), SHP-2-silenced (shRNA 1&4) and SHP-2-overexpressing NKL cells (WT, E76D, or N308D) from at least three separate experiments (2–3 wells/experiment) (see Methods) with each icon representing a separate experiment. A double asterisk indicates a p value of ≤ 0.005 as compared to control cells. Changes in spot intensity after stimulation (data not shown) also showed the same trends as the analysis of spot number. C. Quantification of KHYG-1 cell data from 7 experiments performed as in Panel A and analyzed as in panel B. A single or double asterisk indicates a p value of ≤ 0.05 or ≤ 0.005, respectively, as compared to control cells. Each icon represents the mean of multiple determinations from a separate experiment.
Figure 7
Figure 7. SHP-2 expression in NK cells suppresses MTOC polarization toward the NKIS
A. NKL (NK) and 721.221 (target) cells were mixed together without centrifugation for 30 min at 37°C, transferred to and allowed to bind to poly-L-lysine slides for 10 min, and then fixed, permeabilized and stained to visualize the MTOC (pericentrin, red), the cytolytic granules (perforin, blue) and the polymerized actin cytoskeleton (phalloidin, green). Examples of representative brightfield (left) and fluorescent max projected (right) images of two NK-target cell conjugates (top and bottom rows) are shown. The distance from the centroid of the MTOC to the center of the NKIS is graphically marked with a bracket ({) and the measured distance indicated for each conjugate. B. The mean distance from the MTOC to the NKIS is shown for at least 15 conjugates from 5 separate experiments comparing SHP-2-silenced and SHP-2-overexpressing (WT or E76D) cell conjugates with 721.221 cells as measured in Panel A. C. The same cells used in Panel B were assayed at the time of conjugation for direct cytotoxicity toward 721.221 targets as described in Figure 2. The mean % specific 51Cr release of triplicate samples determined at a 2.5:1 E:T ratio is shown for each experiment. D. Mean distribution of the MTOC distance data for all 5 experiments from Panel B. Each measured conjugate was parsed into 7 different distance categories (e.g. 0–2 µm, 2.1–4 µm, etc) and the mean % of conjugates in each distance category is shown. While a subset of NK cells exhibited efficient MTOC polarization in all populations, the MTOC was further from the NKIS in a greater proportion of NK cells expressing SHP-2-WT or SHP-2-E76D.

Similar articles

Cited by

References

    1. Trinchieri G. Biology of natural killer cells. Adv Immunol. 1989;47:187–376. - PMC - PubMed
    1. Biron CA. Activation and function of natural killer cell responses during viral infections. Curr Opin Immunol. 1997;9:24–34. - PubMed
    1. MacFarlane AWt, Campbell KS. Signal transduction in natural killer cells. Curr Top Microbiol Immunol. 2006;298:23–57. - PubMed
    1. Wu J, Lanier LL. Natural killer cells and cancer. Adv Cancer Res. 2003;90:127–156. - PubMed
    1. Bryceson YT, March ME, Ljunggren HG, Long EO. Activation, coactivation, and costimulation of resting human natural killer cells. Immunol Rev. 2006;214:73–91. - PMC - PubMed

Publication types

MeSH terms