. 2009 Nov;21(11):3700-13.
doi: 10.1105/tpc.109.069971. Epub 2009 Nov 13.

The BTB/POZ domain of the Arabidopsis disease resistance protein NPR1 interacts with the repression domain of TGA2 to negate its function

Affiliations

The BTB/POZ domain of the Arabidopsis disease resistance protein NPR1 interacts with the repression domain of TGA2 to negate its function

Patrick Boyle et al. Plant Cell. 2009 Nov.

Abstract

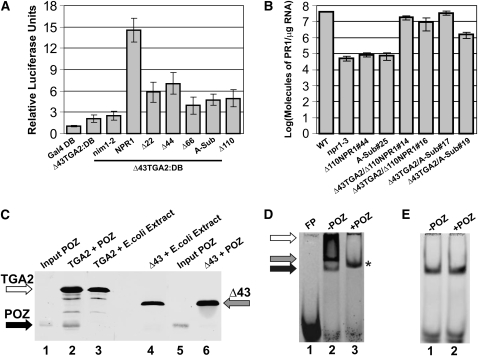
TGA2 and NONEXPRESSER OF PR GENES1 (NPR1) are activators of systemic acquired resistance (SAR) and of the SAR marker gene pathogenesis-related-1 (PR-1) in Arabidopsis thaliana. TGA2 is a transcriptional repressor required for basal repression of PR-1, but during SAR, TGA2 recruits NPR1 as part of an enhanceosome. Transactivation by the enhanceosome requires the NPR1 BTB/POZ domain. However, the NPR1 BTB/POZ domain does not contain an autonomous transactivation domain; thus, its molecular role within the enhanceosome remains elusive. We now show by gel filtration analyses that TGA2 binds DNA as a dimer, tetramer, or oligomer. Using in vivo plant transcription assays, we localize the repression domain of TGA2 to the N terminus and demonstrate that this domain is responsible for modulating the DNA binding activity of the oligomer both in vitro and in vivo. We confirm that the NPR1 BTB/POZ domain interacts with and negates the molecular function of the TGA2 repression domain by excluding TGA2 oligomers from cognate DNA. These data distinguish the NPR1 BTB/POZ domain from other known BTB/POZ domains and establish its molecular role in the context of the Arabidopsis PR-1 gene enhanceosome.


Figures

Figure 1.
Figure 1.
The N Terminus of TGA2 Is Not an Autonomous Repression Domain. (A) Graphic representation of the synthetic 3X Gal4:1X LexA:minimal promoter:Firefly Luciferase reporter gene. The upward arrow indicates the position of the TATA box relative to the RNA start site. The 60bp and 30bp indicate the spacing in base pairs between the most downstream Gal4 element and the LexA element and between the LexA element and the TATA box, respectively. Not shown is an omega translational enhancer in the transcribed region of the Luciferase gene. (B) Bar graph illustrating the assessment of potential transcriptional repression conferred by TGA2, TGA2 with a 43–amino acid N terminus deletion (Δ43), and the first 47, 101, and 144 amino acids of TGA2 (Nt47, Nt101, and Nt144), all tethered to DNA through the Gal4 DNA binding domain (:DB). Where indicated, the LexA DB fused to the viral particle 16 (LexA:VP16) transactivation domain was also transfected in order to activate the reporter gene. The constructs were transfected along with the 3X UASGAL4:1X LexA DNA element:minimal promoter:Firefly luciferase reporter and the CaMV35S:Renilla luciferase internal standard vectors. (C) Bar graph illustrating the fact that TGA2, Nt47, Nt101, and Nt144 tethered to DNA through Gal4 DB (TGA2:DB, Nt47:DB, Nt101:DB, and Nt144:DB) do not activate transcription, while Δ43:DB and a chimeric transcription activator composed of the Gal4 DB fused to the transactivation domain of viral particle 16 (Gal4 DB:VP16 TA) do. Gal4 DB represents the baseline level of transcription. The constructs were transfected along with the 5X UASGAL4:Firefly luciferase reporter and the CaMV35S:Renilla luciferase internal standard vectors. In (B) and (C), Arabidopsis leaves were left untreated (white bars) or were treated for 24 h with 1 mM SA (gray bars). Data are reported as relative luciferase units. Values consist of n = 25 samples and represent averages ± 1 sd. Every bar represents five bombardments repeated five times (n = 25).
Figure 2.
Figure 2.
The Leucine Zipper Is Responsible for TGA2 Oligomerization. Chromatogram illustrating the elution profile of purified His-tagged TGA2 with N-terminal deletions: TGA2 (A), Δ43 (B), Δ68 (C), and Δ93 (D). The leucine zipper is located between amino acids 72 and 86. In (B) to (D), the TGA2 deletion constructs all contain the AUG initiator codon; therefore, the effective deletion starts at amino acid number 2. In (A), the higher absorbance curve contains 50 nmol of TGA2 in 2 mL (25 μM), while the lower one contains 5 nmol of TGA2 in 2 mL (2.5 μM). The concentrations of Δ43, Δ68, and Δ93 were 15, 3, and 10 μM, respectively. In (A) to (D), insets are immunoblot analysis of pooled protein fractions from the chromatogram using an anti-His antibody. Five fractions for each observed or theoretical peak (peak fraction + the two fractions preceding it + the two fractions following it) were acetone precipitated, and 100% of each precipitate was loaded on SDS-PAGE. The remaining fractions between peaks were pooled and precipitated, and 100% of each precipitate was loaded on SDS-PAGE to assess data points between peaks (V0-T, T-D, V0-D, and D-M). V0-T and V0-D pools ([A] to [D]) started from fraction corresponding to mL 43 and V0-D pools (D) ended at fraction corresponding to mL 60. The apparent mobility of the various TGA2 proteins coincided with the expected mobility, based on the size standards (New England Biolabs Broad Range). In (A), the top and bottom panels represent data from the high and low TGA2 concentration, respectively. Void indicates fractions collected from the void volume, while Tetra, Dimer, and Mono represent pooled fractions from the predicted elution profile of a theoretical TGA2, Δ43, or Δ68 tetramer, dimer, and monomer, respectively. V0-T, T-D, and D-M indicate pooled samples corresponding to fractions located between the void volume and tetramer, between the tetramer and dimer, and between the dimer and monomer, respectively. In (D), V0-D indicates pooled samples corresponding to fractions located between the void volume and dimer.
Figure 3.
Figure 3.
The TGA2 Oligomer Can Bind to Its Cognate Sequence LS7 in PR-1. (A) EMSA using recombinant TGA2 (lanes 2 to 18) together with the LS7 DNA as the probe (all lanes). The numbers indicate the ratio of probe concentration to TGA2 concentration. The black, gray, and white arrows indicate the positions of three distinct complexes. FP stands for free probe and refers to an experiment in which only DNA is present. (B) Chromatogram based on the elution profile of the LS7 DNA probe derivatized with fluorescein. The profile of free DNA appears as a dashed line, while that of the DNA (5 μM) incubated with 15 or 5 μM TGA2 is represented by a solid or jagged line, respectively. These profiles are from three separate experiments repeated at least three times. The positions of the maxima corresponding to the void volume and to theoretical entities containing four TGA2 and one DNA probes as well as two TGA2 and one DNA probe are indicated. (C) and (D) Immunoblot analysis of pooled protein fractions from the experiments shown in the chromatogram in (B), using an anti-His antibody. The data are from the high (C) and low (D) TGA2 concentrations. Void indicates fractions collected from the void volume, while Tetramer and Dimer represent pooled fractions from the predicted elution profile of a theoretical TGA2 tetramer bound to two DNA molecules and a TGA2 dimer bound to one DNA molecule. V0-T indicates pooled samples corresponding to fractions located between the void volume and tetramer.
Figure 4.
Figure 4.
Binding of the TGA2 Oligomer to DNA Requires the N-Terminal Domain of TGA2. (A) to (C) EMSA using recombinant Δ43 ([A] and [B]) and TGA2 (C) together with the LS7 DNA probe (A) or the PR-1 probe ([B] and [C]). The numbers indicate the ratio of probe concentration to TGA2 concentration. FP stands for free probe and refers to an experiment in which only DNA is present. In (C), the black, gray, and white arrows indicate the position of three distinct complexes. (D) Fluorescence polarization experiments using recombinant TGA2 together with the LS5 (jagged line) or LS7 (solid line, which appears under the jagged line) DNA as the probe. Values are reported as millianisotropy units. (E) qPCR analyses performed with DNA from wild-type plants, tga2/5/6 mutants, and tga2/5/6 mutant transfected with the Δ43 variant of TGA2 treated (gray bars) or not (white bars) with SA. Following sonication, the cross-linked chromatin was separated by gel filtration on S300. The void volume was collected, the cross-linking reversed, and qPCR was performed using PR1 and ubiquitin (UBQ) primer pairs. Data were reported as the ratio of PR-1 over UBQ and represent averages ± 1 sd. Every bar consists of three technical replicates on two biological replicates (n = 6).
Figure 5.
Figure 5.
The BTB/POZ Domain of NPR1 Interacts with the N terminus of TGA2 and Precludes Binding of the TGA2 Oligomer to DNA. (A) Bar graph illustrating the transactivation properties of Δ43TGA2 fused to the Gal4 DB in complex with NPR1 and five NPR1 BTB/POZ domain mutants not fused to any domain. Results obtained with Gal4 DB alone (Gal4 DB) and Δ43TGA2:DB alone are also shown. Δ22, Δ44, Δ66, and Δ110 indicate NPR1 variants in which the first 22, 44, 66, or 110 amino acids have been deleted, while A-Sub refers to an NPR1 variant in which the core of the BTB/POZ domain has been substituted with Ala residues (see Rochon et al., 2006 for an in-depth rationale of these mutations). nim1-2 is an NPR1 mutant that does not interact with TGA2. Conditions were identical to those described in Figure 1C. Gray bars indicate a treatment with SA. Data are reported as relative luciferase units. Values consist of n = 25 samples and represent averages ± 1 sd. Every bar represents five bombardments repeated five times (n = 25). (B) Bar diagram illustrating the abundance of PR-1 transcript present in wild-type, npr1-3, line 44 of an npr1-3 mutant plant expressing a variant of NPR1 lacking the first 110 amino acids (Δ110NPR1#44), and line 25 of an npr1-3 mutant plant expressing a variant of NPR1 mutated by Ala substitutions in the BTB/POZ domain (A-Sub#25). Δ110NPR1#44 was used as parent to express a TGA2 variant lacking the first 43 amino acids (Δ43TGA2). Two independent lines were tested for PR-1 expression (Δ43TGA2/Δ110NPR1#14 and Δ43TGA2/Δ110NPR1#16). These lines express Δ43TGA2 and Δ110NPR1 in the npr1-3 background. Similarly, A-Sub#25 was used as parent to express a TGA2 variant lacking the first 43 amino acids (Δ43TGA2). Two independent lines were tested for PR-1 expression (Δ43TGA2/A-Sub#17 and Δ43TGA2/A-Sub#19). These lines express Δ43TGA2 and a variant of NPR1, mutated by Ala substitutions in the BTB/POZ domain, in the npr1-3 background. Data for each bar represent averages containing two biological replicates, each composed of six plants. Errors are equal to ± 1 se. Note that the scale is logarithmic. (C) Variation of the pull-down assay in which the solid phase was produced by linking biotinylated LS7 DNA to paramagnetic beads followed by binding of TGA2 (lanes 2 and 3) or Δ43TGA2 (lanes 4 and 6) to the DNA. The NPR1 BTB/POZ domain (lanes 2 and 6) or an E. coli extract (lanes 3 and 4) was incubated with the solid phase. Lanes 1 and 5 contain 20% of the amount of BTB/POZ domain used in lanes 2 and 6. All other lanes contain eluents from the solid phase. Proteins (TGA2, Δ43TGA2, and POZ) were revealed by immunoblots with an anti-His antibody. The black, gray, and white arrows indicate the position of the BTB/POZ domain of NPR1, Δ43TGA2, and TGA2, respectively. (D) EMSA using recombinant TGA2 (lanes 2 and 3) together with the LS7 DNA as the probe. FP stands for free probe and refers to an experiment in which only DNA was present. POZ indicates that the BTB/POZ domain of NPR1 had been added (+) or not (−) to the EMSA reaction. The black, gray, and white arrows indicate the position of three distinct complexes. An asterisk denotes the position of a TGA2-BTB/POZ complex. (E) EMSA identical to that in (D) with the exception that Δ43TGA2 replaced TGA2.
Figure 6.
Figure 6.
Stoichiometry of the TGA2-NPR1-DNA Enhanceosome. (A) Bar graph illustrating the in vivo self-association of the NPR1 BTB/POZ domain (POZ) domain. Self-association was monitored in transient plant two-hybrid system through the reconstitution of an active transcription factor, which activated a reporter gene. POZ was fused to either the Gal4 DB (POZ:DB) or VP16 TA (POZ:TA). Results obtained with Gal4 DB alone (Gal4 DB) and POZ:DB coexpressed with VP16 TA are also shown for comparison. (B) Immunoblot analysis of pooled protein fractions from a Sephacryl S100 chromatogram using an anti-His antibody. Void indicates fractions collected from the void volume, while Dimer and Monomer represent pooled fraction from the predicted elution profile of a theoretical NPR1 BTB/POZ domain dimer and monomer, respectively. V0-D, D-M, and M-Vt indicate pooled samples corresponding to fractions located between the void volume and dimer, between the dimer and monomer, and between the monomer and one column volume, respectively. Crude refers to a crude E. coli extract expressing the NPR1 BTB/POZ domain. (C) Cross-linking experiment of the NPR1 BTB/POZ domain followed by SDS-PAGE analysis indicating that the domain dimerizes. Extracts in lanes 1 and 2 were cross-linked for 5 and 30 min, respectively. XL indicates cross-linking. Predicted positions of the monomer and dimer, as determined from molecular weight standards, are indicated. (D) Bar graph illustrating that the in vivo self-association of NPR1 is dependent on the presence of TGA2. Self-association was monitored in a transient plant two-hybrid or three-hybrid system through the reconstitution of an active transcription factor, which activated a reporter gene. NPR1 was fused to either Gal4 DB (NPR1:DB) or VP16 TA (NPR1:TA). Results obtained with Gal4 DB alone (Gal4 DB) and TGA2:DB are shown for comparison. TGA2:DB coexpressed with NPR1:TA and NPR1:DB coexpressed with TGA2:TA are presented to confirm that TGA2 can interact with both types of NPR1 fusion proteins. Black bars indicate experiments performed following SA treatment and in which TGA2 not fused to any domain was also coexpressed. For (A) and (D), conditions were identical to those described in Figure 1C. Gray bars indicate a treatment with SA. White bars indicate no treatment. Data are reported as relative luciferase units. Values consist of n = 25 samples and represent averages ± 1 sd. Every bar represents five bombardments repeated five times (n = 25). (E) Chromatogram based on the elution profiles of the LS7 DNA probe derivatized with fluorescein. The profile of free DNA appears as a dashed line (the sample also contained NPR1, which does not interact with the DNA), while that of the DNA incubated with 5 μM of TGA2 (which binds as a dimer under these conditions; Figure 3B) is represented by a jagged line. The solid line corresponds to an elution profile in which the sample contained TGA2 (0.5 μM), NPR1 (1 μM), and DNA (0.5 μM). The black arrow corresponds to a theoretical entity containing two TGA2, one NPR1, and one DNA probe, while the gray arrow corresponds to one containing two TGA2, two NPR1, and one DNA probe. The inset is an immunoblot analysis using an anti-NPR1 antibody (Després et al., 2000). Void indicates fractions collected from the void volume. 2NPR1 and 1NPR1 correspond to fractions potentially containing an entity composed of two TGA2, two NPR1, and one DNA probe or two TGA2, one NPR1, and one DNA probe, respectively. V0-2NPR1 indicates pooled samples corresponding to fractions located between the void volume and 2NPR1. (F) Immunoblot analysis of pooled protein fractions from an S300 elution profile of NPR1 alone using an anti-His antibody. Void indicates fractions collected from the void volume, while Dimer and Monomer represent pooled fractions from the predicted elution profile of a theoretical NPR1 dimer and monomer, respectively. V0-D and D-M indicate pooled samples corresponding to fractions located between the void volume and dimer and between the dimer and monomer, respectively.
Figure 7.
Figure 7.
Working Model for the Regulation of TGA2 by NPR1 and Stoichiometry of the TGA2-NPR1 Enhanceosome. Left panel: In untreated cells, where NPR1 does not interact with TGA2, TGA2 would form an oligomer capable of binding to its cognate TGACG sequence in the promoter of target genes. This oligomer would repress transcription by a mechanism yet to be identified. Oligomerization of TGA2 on DNA involves the leucine zipper and the N-terminal repression domain. Right panel: After a rise in SA, the NPR1 BTB/POZ domain (POZ) would either assist in disassembling the TGA2 oligomer or assist in recruiting TGA2 dimers to cognate DNA, while excluding TGA2 tetramers and oligomers from binding DNA. The TGA2-NPR1 enhanceosome is likely to have a stoichiometry of 2:2 (TGA2:NPR1). The BTB/POZ domain of NPR1 dimerizes and interacts with the N-terminal repression domain of TGA2 (gray) to mask its capacity to form an oligomer on DNA. The ankyrin repeats (ANK) are the major interfaces stabilizing the TGA2-NPR1 complex, while the C-terminal region of NPR1 contains the transactivation domain (TA) of the enhanceosome.

References

    1. Ahmad, K.F., Engel, C.K., and Prive, G.G. (1998). Crystal structure of the BTB domain from PLZF. Proc. Natl. Acad. Sci. USA 95 12123–12128. - PMC - PubMed
    1. Aoki, K., Suzuki, K., Ishida, R., and Kasai, M. (1999). The DNA-binding activity of Translin is mediated by a basic region in the ring-shaped structure conserved in evolution. FEBS Lett. 443 363–366. - PubMed
    1. Aravind, L., and Koonin, E.V. (1999). Fold prediction and evolutionary analysis of the POZ domain: Structural and evolutionary relationship with the potassium channel tetramerization domain. J. Mol. Biol. 285 1353–1361. - PubMed
    1. Bardwell, V.J., and Treisman, R. (1994). The POZ domain: A conserved protein-protein interaction motif. Genes Dev. 8 1664–1677. - PubMed
    1. Cao, H., Bowling, S.A., Gordon, A.S., and Dong, X. (1994). Characterization of an Arabidopsis mutant that is nonresponsive to inducers of systemic acquired resistance. Plant Cell 6 1583–1592. - PMC - PubMed

Publication types

MeSH terms