. 2009 Nov;21(11):3518-34.
doi: 10.1105/tpc.108.064139. Epub 2009 Nov 13.

Dof5.6/HCA2, a Dof transcription factor gene, regulates interfascicular cambium formation and vascular tissue development in Arabidopsis

Affiliations

Dof5.6/HCA2, a Dof transcription factor gene, regulates interfascicular cambium formation and vascular tissue development in Arabidopsis

Yong Guo et al. Plant Cell. 2009 Nov.

Abstract

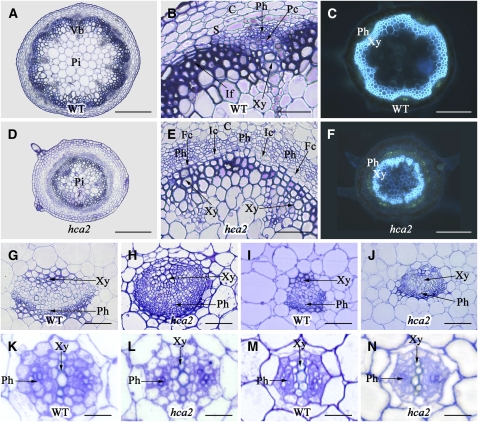
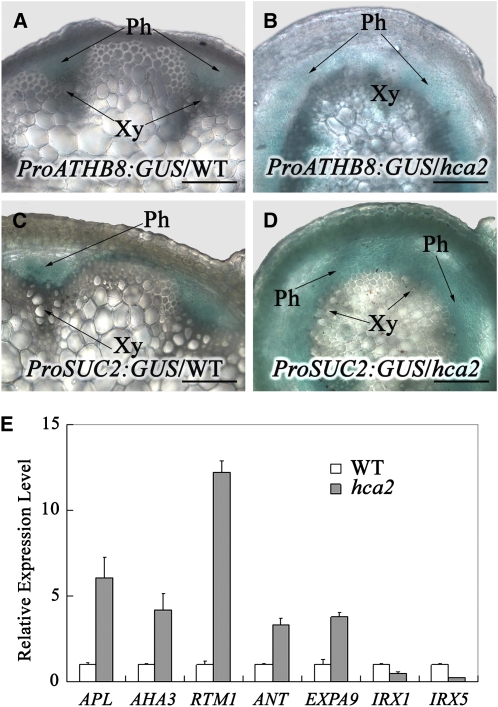
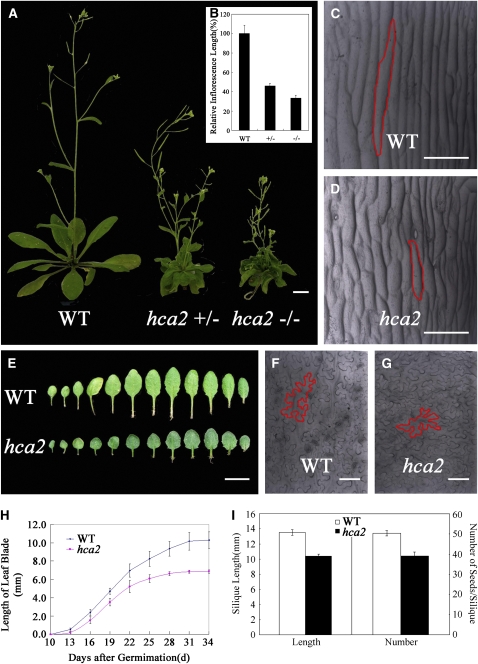
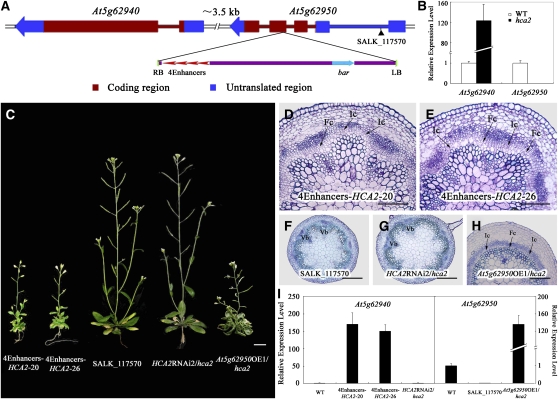
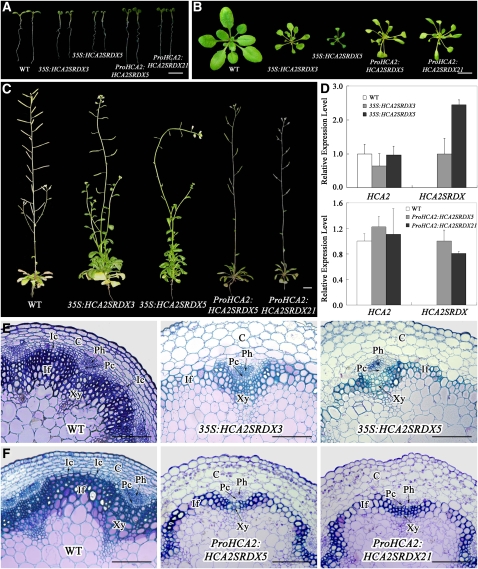
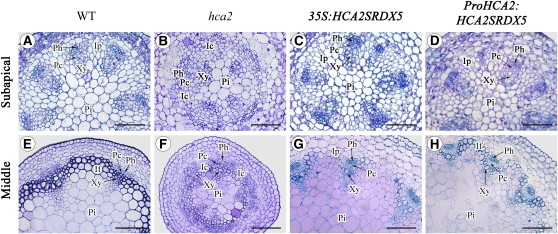
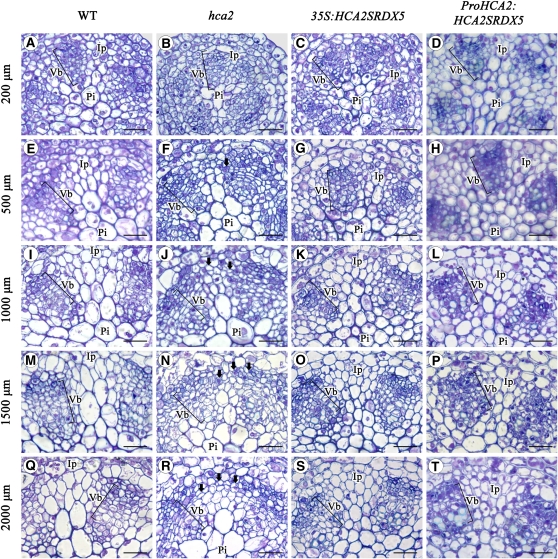
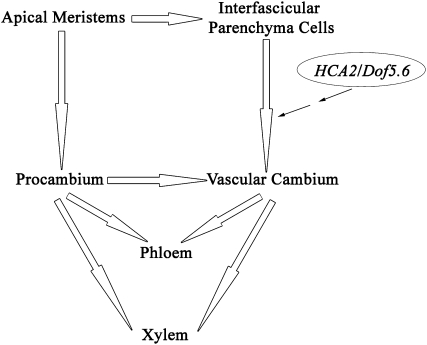
Vascular cambium, a type of lateral meristem, is the source of secondary xylem and secondary phloem, but little is known about the molecular mechanisms of its formation and development. Here, we report the characterization of an Arabidopsis thaliana gain-of-function mutant with dramatically increased cambial activity, designated high cambial activity2 (hca2). The hca2 mutant has no alternative organization of the vascular bundles/fibers in inflorescence stems, due to precocious formation of interfascicular cambium and its subsequent cell division. The phenotype results from elevated expression of HCA2, which encodes a nuclear-localized DNA binding with one finger (Dof) transcription factor Dof5.6. Dof5.6/HCA2 is preferentially expressed in the vasculature of all the organs, particularly in the cambium, phloem, and interfascicular parenchyma cells of inflorescence stems. Dominant-negative analysis further demonstrated that both ubiquitous and in situ repression of HCA2 activity led to disruption of interfascicular cambium formation and development in inflorescence stems. In-depth anatomical analysis showed that HCA2 promotes interfascicular cambium formation at a very early stage of inflorescence stem development. This report demonstrates that a transcription factor gene, HCA2, is involved in regulation of interfascicular cambium formation and vascular tissue development in Arabidopsis.


Figures

Figure 1.
Figure 1.
Transverse Sections of Vascular Tissues from 6-Week-Old Plants or 7-d-Old Seedlings of the Wild Type and hca2. (A), (B), (D), and (E) Resin-embedded transverse sections of the basal portion of the inflorescence stem from wild-type ([A] and [B]) and hca2 ([D] and [E]) plants stained with Toluidine blue. (B) and (D) Higher magnifications of wild-type and hca2 vascular tissues, respectively. (C) and (F) Hand-cut transverse sections of the basal portion of the inflorescence stem from wild-type (C) and hca2 (F) plants stained with Aniline blue and observed under UV light. (G) and (H) Resin-embedded transverse sections of vascular bundles of petioles from wild-type (G) and hca2 (H) plants. (I) and (J) Resin-embedded transverse sections of main veins of rosette leaves from wild-type (I) and hca2 (J) plants. (K) and (L) Resin-embedded transverse sections of vascular bundles of hypocotyls from 7-d-old wild-type (K) and hca2 (L) seedlings. (M) and (N) Resin-embedded transverse sections of vascular bundles of roots from 7-d-old wild-type (M) and hca2 (N) seedlings. C, cortex; If, interfascicular fiber; Pc, (pro)cambium; Pi, pith; Ph, phloem; S, starch sheath; Vb, vascular bundle; Xy, xylem; Fc, fascicular cambium; Ic, interfascicular cambium. Bars = 200 μm in (A), (C), (D), and (F), 50 μm in (B), (E), and (G) to (J), and 20 μm in (K) to (N).
Figure 2.
Figure 2.
The Expression Pattern of Cambium/Phloem/Xylem Biased Genes Is Altered in the hca2 Mutant. (A) and (B) GUS staining in transverse hand-cut sections from the basal portion of the stem of 6-week-old ProATHB8:GUS plants in wild-type (A) and hca2 (B) backgrounds. (C) and (D) GUS staining in transverse hand-cut sections from the basal portion of the stem of 6-week-old ProSUC2:GUS plants in wild-type (C) and hca2 (D) backgrounds. (E) The expression level of phloem (APL, AHA3, and RTM1)/cambium (ANT and EXPA9)/xylem (IRX1 and IRX5) biased genes in the inflorescence stems of the wild type and hca2. The expression levels of each gene in the wild type are set to 1.0, and error bars represent sd of three biological replicates. Ph, phloem; Xy, xylem. Bars = 100 μm in (A) to (D).
Figure 3.
Figure 3.
Wild-Type and hca2 Morphology. (A) and (B) Six-week-old plants grown under long-day conditions (A) and final height of the wild-type and hca2 plants (B). The symbol +/− represents heterozygous mutant, while −/− represents homozygous mutant. The heights of inflorescence stems of at least 15 plants were measured. The average inflorescence stem height of the wild type is set to 100%, and the bars represent sd. (C) and (D) Basal part of inflorescence stems from 6-week-old wild-type (C) and hca2 (D) plants visualized by scanning electron micrograph. The red outlines indicate the cell boundary of one single epidermal cell. (E) Comparison of rosette leaves between wild-type and hca2 plants. Leaves are arranged from the first leaf at the left to the latest leaf at the right. (F) and (G) Adaxial epidermis of wild-type leaf (F) and hca2 leaf (G) visualized by scanning electron micrograph. The red outlines indicate the cell boundary of one single epidermal cell. (H) The growth rate curves of fifth true leaves from wild-type and hca2. At least 15 plants were measured, and the bars represent sd. (I) Silique length and seed number per silique from wild-type and hca2 plants. At least 20 siliques were examined and the bars represent sd. Bars = 1 cm in (A), 1 mm in (E), and 50 μm in (C), (D), (F), and (G).
Figure 4.
Figure 4.
Characterization of the HCA2 Gene. (A) Schematic of the genomic region flanking the T-DNA insertion site in hca2 and SALK_117570. The arrow direction represents the transcriptional orientation of the gene. The four red arrowheads represent the four 35S enhancers from pSKI015. LB, T-DNA left border; bar, Basta resistance gene; 4Enhancers, CaMV 35S enhancer tetrad; RB, T-DNA right border. (B) Expression of At5g62940 and At5g62950 in the wild type and the homozygous hca2 mutant measured by quantitative RT-PCR with UBQ10 as an internal control. The expression levels of each gene in the wild type are set to 1.0, and error bars represent sd of three biological replicates. (C) Transgenic plants overexpressing At5g62940 driven by 4× 35S enhancers (4Enhancers-HCA2-20 and -26) show the mutant phenotype, while SALK_117570 did not have any observable phenotype; hca2 transformed with the HCA2 RNAi construct or the At5g62950 overexpression construct (OE1) had wild-type or mutant phenotypes, respectively. (D) to (F) Resin-embedded transverse sections of the basal portion of the stem from transgenic plants line 20 (D), line 26 (E), and SALK_117570 (F) stained with Toluidine blue. (G) and (H) hca2 transformed with the HCA2 RNAi construct exhibits a wild-type vascular phenotype (G), while hca2 transformed with the At5g62950 overexpression construct has the mutant vascular phenotype (H). (I) Expression levels of At5g62940 and At5g62950 in transgenic plants and SALK_117570 were measured with quantitative RT-PCR. The expression levels of each gene in the wild type are set to 1.0, and error bars represent sd of three biological replicates. Fc, fascicular cambium; Ic, interfascicular cambium; Vb, vascular bundle. Bars = 1 cm in (C), 100 μm in (D) and (E), and 200 μm in (F) to (H).
Figure 5.
Figure 5.
Subcellular Localization of YFP-HCA2 Protein and Transactivation Activity of HCA2. (A) Trichome of leaf from wild-type plant visualized under the fluorescence microscope. (B) Trichome of leaf from 35S:YFP plant visualized under the fluorescence microscope. (C) Trichome of leaf from 35S:YFP-HCA2 plant visualized under the fluorescence microscope. (D) Transactivation activity of HCA2 in yeast. The full-length open reading frame of HCA2 and its deletion constructs are illustrated schematically. The Dof domain is labeled. The panels to the right show yeast transformed with the indicated constructs. Blue color represents transactivation. Bars = 200 μm in (A) to (C).
Figure 6.
Figure 6.
Spatial Expression Pattern of HCA2. (A) Analysis of HCA2 expression level in different organs by quantitative RT-PCR. The expression level in the seedling is set to 1.0, and error bars represent sd of three biological replicates. Wild-type plants were transformed with the ProHCA2:GUS fusion construct. (B) GUS-stained 5-d-old seedling growing on Murashige and Skoog solid medium. (C) Longitudinal view of GUS-stained root from 5-d-old seedling. (D) GUS and Safranin (red color)-stained 7-μm cross section of the maturation zone of primary roots. (E) GUS-stained cotyledon of 13-d-old seedling. (F) to (H) GUS-stained rosette leaf (F), cauline leaf (G), and flower (H) of a 6-week-old plant. (I) and (J) Transverse sections of an inflorescence stem. Note the GUS staining in cambium, phloem, and interfascicular parenchyma cells. Bold arrows in (J) indicate the GUS-stained cells. C, cortex; If, interfascicular fiber; Pc, (pro)cambium; Ph, phloem; Xy, xylem; Ip, interfascicular parenchyma cell. Bars = 1 mm in (B) and (E) to (H), 100 μm in (C), 20 μm in (D), and 50 μm (I) and (J).
Figure 7.
Figure 7.
Both Ubiquitous and in Situ Expression of the Chimeric HCA2 Repressors Alter Vascular Patterning in Arabidopsis. (A) Seven-day-old wild-type, 35S:HCA2SRDX, and ProHCA2:HCA2SRDX plants are shown. Two independent lines are shown for each transgene. (B) Four-week-old wild-type, 35S:HCA2SRDX, and ProHCA2:HCA2SRDX plants are shown. (C) Eight-week-old wild-type, 35S:HCA2SRDX, and ProHCA2:HCA2SRDX plants are shown. (D) The expressions of the HCA2SRDX transgene and the endogenous HCA2 gene in 35S:HCA2SRDX or ProHCA2:HCA2SRDX plants were examined by quantitative RT-PCR analysis. The expression levels of HCA2 in the wild type and HCA2SRDX in 35S:HCA2SRDX3 or ProHCA2:HCA2SRDX5 are set to 1.0, and error bars represent sd of three biological replicates. (E) Resin-embedded transverse sections of the basal part of the stem from wild-type and two lines of 35S:HCA2SRDX plants. (F) Resin-embedded transverse sections of the basal part of the stem from wild-type and two lines of ProHCA2:HCA2SRDX plants. C, cortex; If, interfascicular fiber; Pc, (pro)cambium; Ph, phloem; Xy, xylem; Fc, fascicular cambium; Ic, interfascicular cambium. Bars = 0.5 cm in (A), 1 cm in (B) and (C), and 100 μm (E) and (F).
Figure 8.
Figure 8.
Vascular Tissue Development of the Inflorescence Stems in Wild-Type, hca2, 35S:HCA2SRDX5, and ProHCA2:HCA2SRDX5 Plants. (A) to (D) Resin-embedded transverse sections of the subapical part of the inflorescence stem from wild-type (A), hca2 (B), 35S:HCA2SRDX5 (C), and ProHCA2:HCA2SRDX5 (D) plants. (E) to (H) Resin-embedded transverse sections of the middle part of the inflorescence stem from wild-type (E), hca2 (F), 35S:HCA2SRDX5 (G), and ProHCA2:HCA2SRDX5 (H) plants. If, interfascicular fiber; Pc, (pro)cambium; Ph, phloem; Xy, xylem; Ic, interfascicular cambium; Ip, interfascicular parenchyma cell; Pi, pith. Bars = 50 μm in (A) to (D) and 100 μm in (E) to (H).
Figure 9.
Figure 9.
Vascular Tissue Development at the Subapical Part of the Inflorescence Stems in 6-Week-Old Wild-Type, hca2, 35S:HCA2SRDX5, and ProHCA2:HCA2SRDX5 Plants. Serial cross sections of the subapical part of the inflorescence stems from the wild type ([A], [E], [I], [M], and [Q]), hca2 ([B], [F], [J], [N], and [R]), 35S:HCA2SRDX5 ([C], [G], [K], [O], and [S]), and ProHCA2:HCA2SRDX5 ([D], [H], [L], [P], and [T]) were taken, and the images 200 μm ([A] to [D]), 500 μm ([E] to [H]), 1000 μm ([I] to [L]), 1500 μm ([M] to [P]), and 2000 μm ([Q] to [T]) from apex are shown. Bold arrows in this diagram indicate interfascicular parenchyma cell divisions. Ip, interfascicular parenchyma cell; Vb, vascular bundle; Pi, pith. Bars = 20 μm.
Figure 10.
Figure 10.
A Possible Model for the Role of HCA2 during Vascular Cambium Development in Arabidopsis. The diagram briefly describes the Dof5.6/HCA2 gene involved in vascular tissue development in the inflorescence stems of Arabidopsis. The black and white arrows represent that one tissue generates from the other, and the thin arrow indicates that Dof5.6/HCA2 may directly or indirectly regulate the developmental process from interfascicular parenchyma cells to vascular cambium.

Similar articles

Cited by

References

    1. Altamura, M.M., Possenti, M., Matteucci, A., Baima, S., Ruberti, I., and Morelli, G. (2001). Development of the vascular system in the inflorescence stem of Arabidopsis. New Phytol. 151 381–389.
    1. Baima, S., Nobili, F., Sessa, G., Lucchetti, S., Ruberti, I., and Morelli, G. (1995). The expression of the Athb-8 homeobox gene is restricted to provascular cells in Arabidopsis thaliana. Development 121 4171–4182. - PubMed
    1. Baima, S., Possenti, M., Matteucci, A., Wisman, E., Altamura, M.M., Ruberti, I., and Morelli, G. (2001). The Arabidopsis ATHB-8 HD-zip protein acts as a differentiation-promoting transcription factor of the vascular meristems. Plant Physiol. 126 643–655. - PMC - PubMed
    1. Baucher, M., El Jaziri, M., and Vandeputte, O. (2007). From primary to secondary growth: Origin and development of the vascular system. J. Exp. Bot. 58 3485–3501. - PubMed
    1. Bonke, M., Thitamadee, S., Mahonen, A.P., Hauser, M.T., and Helariutta, Y. (2003). APL regulates vascular tissue identity in Arabidopsis. Nature 426 181–186. - PubMed

Publication types

MeSH terms

Substances