. 2009 Dec;41(12):2191-8.
doi: 10.1249/MSS.0b013e3181a8d553.

The Western States 100-Mile Endurance Run: participation and performance trends

Affiliations

The Western States 100-Mile Endurance Run: participation and performance trends

Martin D Hoffman et al. Med Sci Sports Exerc. 2009 Dec.

Abstract

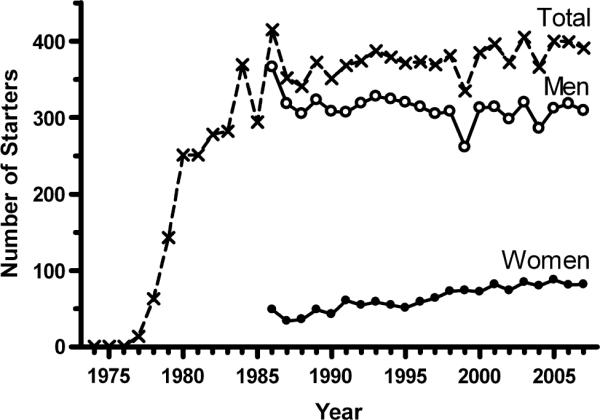
Purpose: Examine changes in demographics of participants and performance trends at the Western States 100-Mile Endurance Run (WSER) since its inception in 1974.

Methods: Name, age, sex, and finish information was obtained on runners in the WSER from 1974 to 2007. Linear regression analyses, ANOVA, and t-tests were used to examine participation and performance trends.

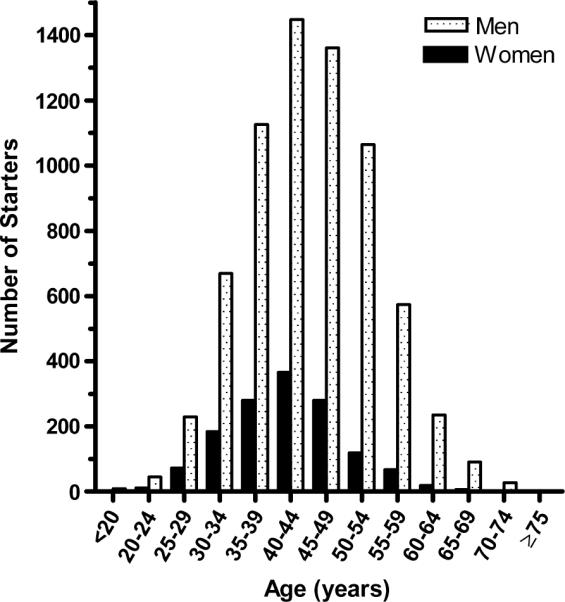
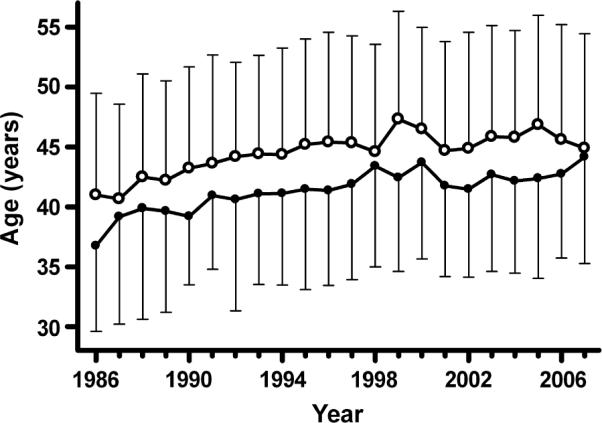
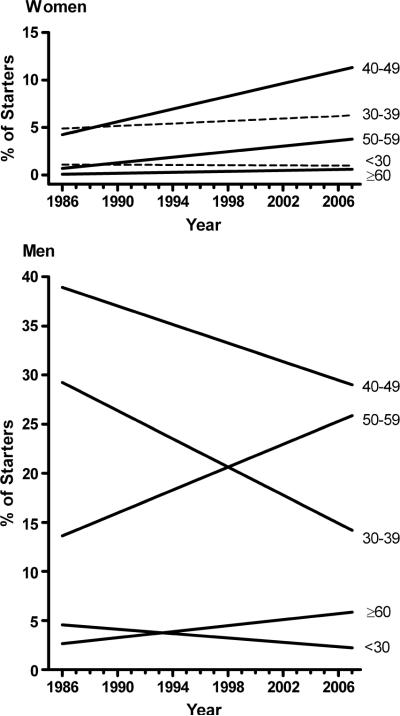
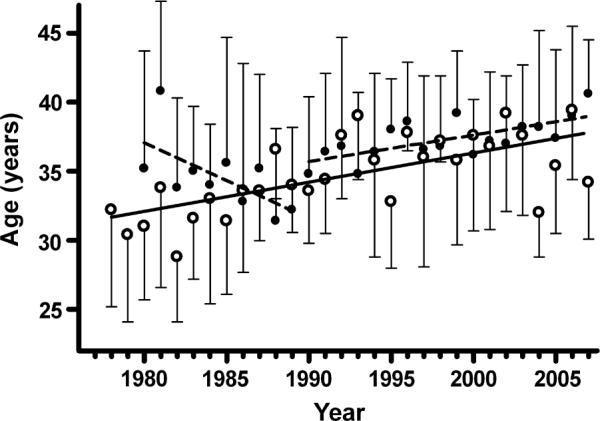
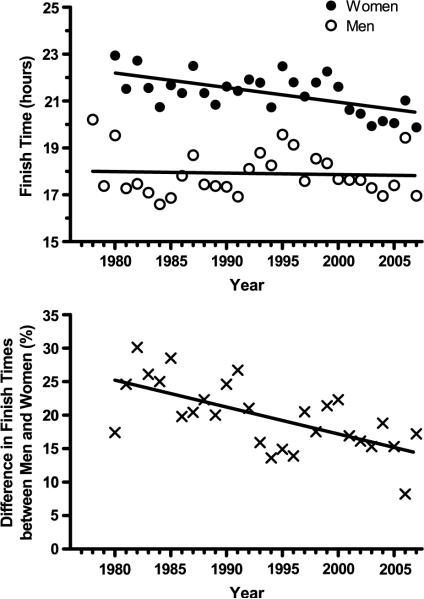
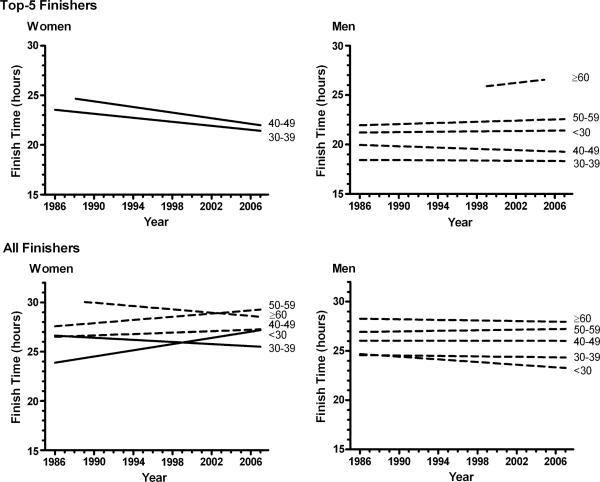
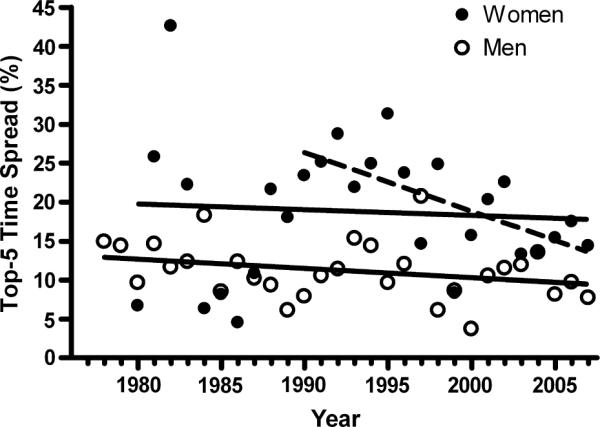
Results: The mean age of participants increased (P < 0.001) to around 45 yr, with men being an average of 3 yr older (P < 0.001) than women. The increase in average age of starters was accounted for by the growth in participation among women >or=40 yr and men >or=50 yr, and by the decreasing participation among men <50 yr. Between 1986 and 2007, there was an increasing participation among women to around 20% of all starters. With this came improved (P < 0.01) finish times for the top 5 overall women and the top 5 women in the 30-39 and 40-49 yr age groups, whereas performances among the men did not improve over this time span. Average ages of the top performers increased (P <or= 0.002) since 1990 to the upper 30s for both sexes, but the fastest times among men were comparable across the 30-39 and 40-49 yr age groups.

Conclusions: Participation in the WSER has increased among women and older athletes, and the ages of the fastest runners at the WSER have gradually risen to the extent that these runners are older than the ages at which the fastest marathons are run. In contrast to what has been observed for men, finish times have improved for the top women across the last two decades at the WSER.


Figures

FIGURE 1
FIGURE 1
Total number of starters from 1974 to 2007, and number of starters of each sex from 1986 to 2007. Sex-specific starting data are not available before 1986.
FIGURE 2
FIGURE 2
Age distribution of starters from 1986 to 2007.
FIGURE 3
FIGURE 3
Mean ages of starters across the period of 1986 through 2007. Men are represented by open circles, and women are represented by closed circles. Brackets represent 1 SD and are displayed in only one direction for clarity.
FIGURE 4
FIGURE 4
Linear regressions defining the percentages of starters within different age groups across the period of 1986 through 2007. Solid lines represent conditions where the slopes of the linear regressions were significantly different (P < 0.05) from zero. Dashed lines are indicative of slopes that were not significantly different from zero.
FIGURE 5
FIGURE 5
Frequency distribution of number of finishes for those individuals having finished the run from 1974 to 2007. Note that the vertical axis is on a log scale.
FIGURE 6
FIGURE 6
Finish rates from 1977 to 2007. Sex-specific finish rates were not available until 1986, so overall finish rates are displayed from 1977 through 1985.
FIGURE 7
FIGURE 7
Distribution of finish times for years 1986 through 2007. Men are represented by stippled bars; women are represented by solid bars. The small number of finishers between 30 and 32 h was because cutoff times were extended to 32 h in 1995 and 1998 because of heavy snow on the early portion of the course.
FIGURE 8
FIGURE 8
Mean finish times as a function of age group (<30, 30–39, 40–49, 50–59, 60–69, and ≥70 yr) for men (open circles) and women (closed circles), considering the average for all finishers (solid lines) as well as the fastest finishes (broken lines) for each year. Data are for 1986 through 2007, plotted at the mean age of those considered within each age group. Brackets represent 1 SD and are displayed in only one direction for clarity. Data displayed for the ≥70 men represent a total of four finishes in 2 yr.
FIGURE 9
FIGURE 9
Mean ages of top 5 overall men and women finishers from 1978 for men (open circles) and 1980 (first year with more than five women finishers) for women (closed circles). Brackets represent 1 SD and are displayed in only one direction for clarity. Solid line represents the linear trend for men (slope = 0.21, r2 = 0.43, P < 0.001). The two broken lines represent linear trends for women across the time ranges of 1980 through 1989 (slope = −0.55, r2 = 0.41, P = 0.045) and 1990 through 2007 (slope = 0.19, r2 = 0.48, P = 0.0015).
FIGURE 10
FIGURE 10
Mean finish times for the top 5 overall finishers across time (top panel) and differences in average finish times between the top 5 women and top 5 men as a percentage of the average time for the top 5 men (bottom panel). In the top panel, data are presented from 1978 for men and 1980 for women, which were the first years in which there were more than five finishers from either sex. The linear regression curve for the women was defined by the equation y = −0.062x + 144.9 (r2 = 0.37, P = 0.0006); the curve for the men had a slope that was not significantly different from zero. In the bottom panel, the linear regression curve was defined by the equation y = −0.402x + 821.1 (r2 = 0.43, P = 0.0002). Data before 1986 (when the course was less than a full 161 km) were included because other yearly variations in performance seemed to have greater effects on finish times than the modifications in the course.
FIGURE 11
FIGURE 11
Mean finish times by year for top 5 finishers (upper panels) and all finishers (lower panels) in each age group for women (left side) and men (right side). Solid lines represent conditions where the slopes of the linear regressions were significantly different (P < 0.05) from zero. Dashed lines indicate the slopes of the linear regressions were not significantly different from zero. Top 5 data were considered when there were ≥10 finishers in the age group, and the all-finisher data were considered when there were ≥5 finishers in the age group. Lines traverse only the range of years for which data were considered.
FIGURE 12
FIGURE 12
Top 5 time spreads for men and women across time. Data are shown from 1978 for men and 1980 for women (first years with more than five finishers for either sex) with linear regressions across this time span shown by the solid lines. The slopes for both curves were not different from zero (P = 0.12 for men, P = 0.72 for women), but the top 5 time spread for women in 1980 was 7 percentage points higher (P < 0.05) than for men. The dashed line is the linear regression for women between 1990 and 2007, where time spread decreased by 0.75 percentage points per annum (P = 0.003).

References

    1. Bam J, Noakes TD, Juritz J, Dennis SC. Could women outrun men in ultramarathon races? Med Sci Sports Exerc. 1997;29(2):244–7. - PubMed
    1. Brannen D, Milroy A. Across America on foot: The Bunion Derbies of 1928 and 1929. In: Allison D, editor. A Step Beyond: A Definitive Guide to Ultrarunning. UltraRunning Publishers; Weymouth (MA): 2004. pp. 280–9.
    1. Coyle EF. Physiological regulation of marathon performance. Sports Med. 2007;37(4–5):306–11. - PubMed
    1. Hoffman MD. Ultramarathon trail running comparison of performance-matched men and women. Med Sci Sports Exerc. 2008;40(9):1681–6. - PubMed
    1. Hoffman MD. Anthropometric characteristics of ultramarathoners. Int J Sports Med. 2008;29:1–4. - PubMed

Publication types