. 2009 Dec;12(12):1594-600.
doi: 10.1038/nn.2439. Epub 2009 Nov 15.

Attention improves performance primarily by reducing interneuronal correlations

Affiliations

Attention improves performance primarily by reducing interneuronal correlations

Marlene R Cohen et al. Nat Neurosci. 2009 Dec.

Abstract

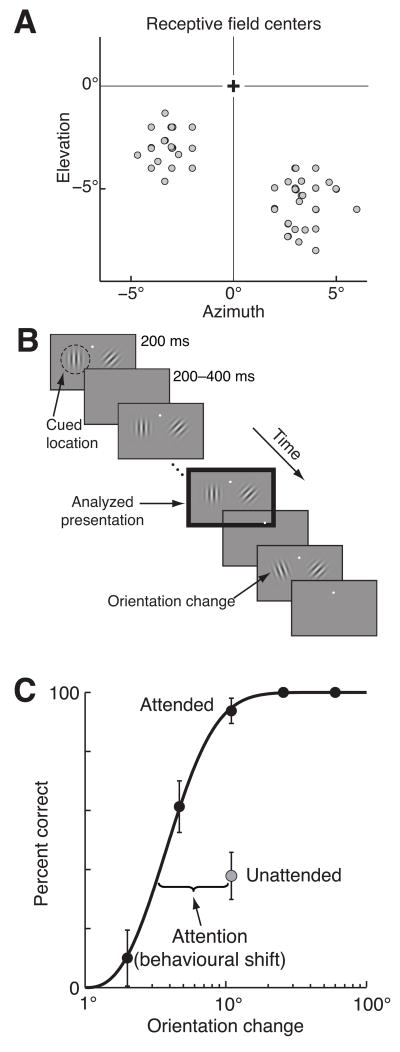
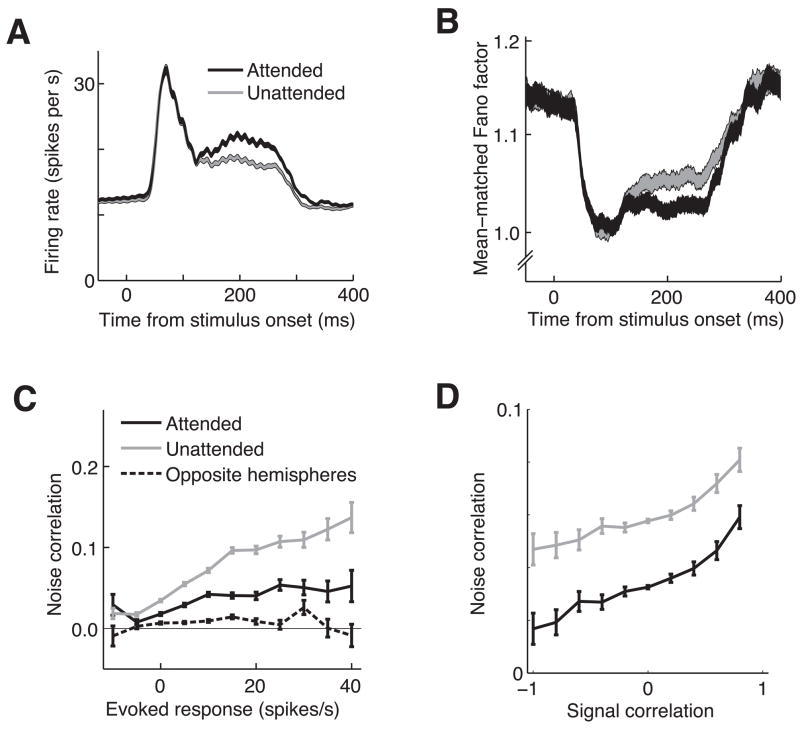
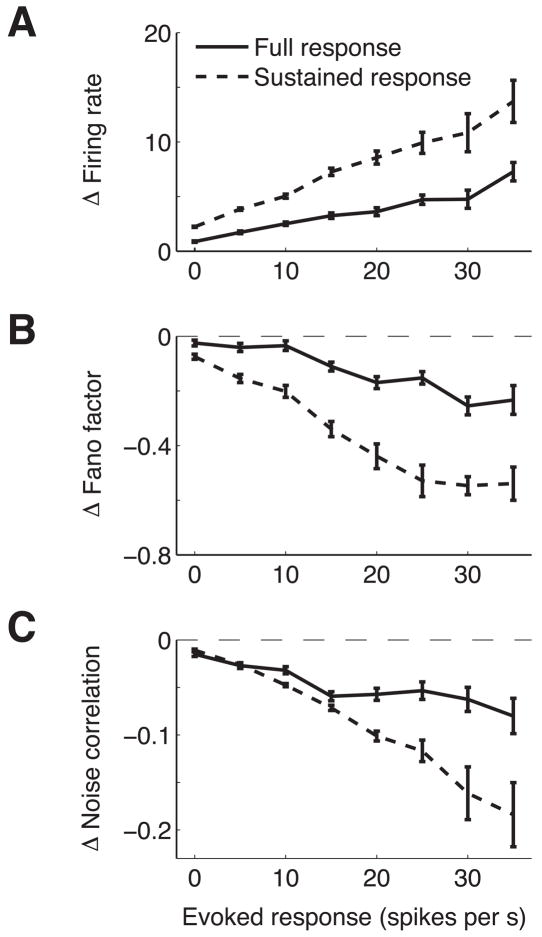
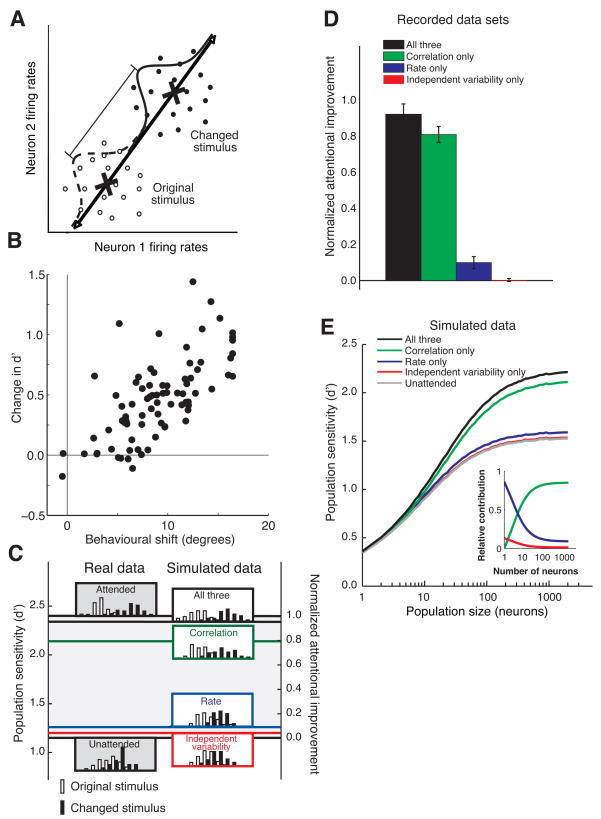
Visual attention can improve behavioral performance by allowing observers to focus on the important information in a complex scene. Attention also typically increases the firing rates of cortical sensory neurons. Rate increases improve the signal-to-noise ratio of individual neurons, and this improvement has been assumed to underlie attention-related improvements in behavior. We recorded dozens of neurons simultaneously in visual area V4 and found that changes in single neurons accounted for only a small fraction of the improvement in the sensitivity of the population. Instead, over 80% of the attentional improvement in the population signal was caused by decreases in the correlations between the trial-to-trial fluctuations in the responses of pairs of neurons. These results suggest that the representation of sensory information in populations of neurons and the way attention affects the sensitivity of the population may only be understood by considering the interactions between neurons.


Figures

Figure 1
Figure 1
Methods and behaviour. A. Center of visual receptive fields for the multiunit signals from one monkey. B. Orientation change detection task. Two Gabor stimuli synchronously flashed on for 200 ms and off for a randomized 200–400 ms period. At an unsignaled and randomized time, the orientation of one of the stimuli changed, and the monkey was rewarded for making a saccade to the stimulus that changed. Attention was cued in blocks, and the cue was valid on 80% of trials, meaning that on an “attend-left” block of trials (depicted here), 80% of orientation changes were to the left stimulus. The monkey was rewarded for correctly detecting any change, even on the unattended side. Unless otherwise stated, all analyses were performed on responses to the stimulus before the orientation change (black outlined panel). C. Psychometric performance from a typical example experiment. Proportion correct as a function of orientation change in degrees for trials in which the change occurred at the attended (black points) or unattended (grey point) location. Unattended changes occurred only at the middle difficulty level (11°). Attentional improvement in behaviour was quantified as the lateral shift between the percent correct on unattended trials and the fitted psychometric curve for attended trials.
Figure 2
Figure 2
Attentional modulation of firing rate, Fano factor, and noise correlation. A. Attention increases firing rates. Peri-stimulus time histogram of firing rates for all 3,498 single neurons and multiunit clusters on trials when the stimulus in the same hemifield as the neuron’s receptive field was attended (black line) or unattended (grey line). Line width represents the SEM. B. Attention decreases mean-matched Fano factor. Plotting conventions are as in A. C. Attention decreases noise correlation. Spike count noise correlation (for responses over the period from 60 to 260 ms following stimulus onset) is plotted as a function of the mean stimulus modulation for the pair of neurons (firing rate during the stimulus – firing rate during the interstimulus blank period). For pairs of neurons in the same hemisphere, correlation was lower when the stimulus in the neurons’ receptive field was attended (black line) than when it was unattended (grey line). Pairs of neurons in opposite hemispheres (dashed lines) had correlations that were close to zero. Error bars represent SEM. D. Raw noise correlation, but not attentional modulation, signal correlation depends on signal correlation. Mean noise correlation is plotted as a function of signal correlation, which can be thought of as the similarity in spatial and feature tuning of the two neurons (see Methods). As has been previously reported, noise correlation increases with signal correlation. However, the difference in correlation between the attended (black line) and unattended (grey line) conditions did not depend on signal correlation. Error bars represent SEM.
Figure 3
Figure 3
Attention has the biggest effects on the most responsive neurons. A. Difference in mean firing rate between trials when the stimulus in the neuron’s receptive field was attended and unattended as a function of stimulus modulation (rate during stimulus period – interstimulus period). Error bars represent SEM. B. Same, for Fano factor. C. Same, for noise correlation for pairs of neurons in the same hemisphere.
Figure 4
Figure 4
Modulation of noise correlation accounts for the majority of the attentional improvement in population sensitivity. A. Procedure for calculating the sensitivity of the population. For each trial and attentional condition, the firing rate response of the n neurons recorded simultaneously in a given hemisphere to the stimulus immediately before the orientation change (open circles) and the changed stimulus (filled circles) is plotted as a point in an n-dimensional space (a fictional two-neuron example is plotted here). The axis of discrimination (black line) is the line connecting center of mass of the n-dimensional cloud of points for each time period (X’s). Each point is projected onto the axis, leaving a one-dimensional distribution of projected values for each time period (dashed and solid curves). The sensitivity of the population to the change in the stimulus is quantified as the discriminability of the two distributions in units of d′ (the difference between changed mean and original mean divided by the standard deviation). B. Population d′ and behavioral improvement are highly correlated. For each hemisphere-day, population d′ is plotted as a function of the behavioral improvement (quantified as the lateral shift between performance at the unattended location and the fitted psychometric curve for the attended condition). C. Procedure for calculating the amount of the observed attentional improvement explained by each factor for a representative example data set. Histograms of projections onto the axis defined in A are plotted for the real data (left column, for attended and unattended trials), and for simulations (right column). We defined the observed attentional improvement as the difference between the d’s for the two attentional conditions (d′=2.40 for the attended condition and 1.15 for the unattended condition, giving an improvement of 1.25 in this example). The left axis represents d′ and the right axis represents normalized proportion of attentional improvement (by definition 1.0 for the attended condition and 0.0 for the unattended condition). To isolate the contribution of each factor (or group of factors), we simulated responses of an identically sized population of neurons with the same mean firing rate, Fano factor, and noise correlation as each of the neurons in our data set in which the statistics of the labeled factor/s matched the data for the attended condition and the other factors matched the data for the unattended condition (right column of distributions). We calculated the fraction of the observed attentional improvement explained by each factor/s by comparing the simulated d′ to the d′ for the real unattended data. In this data set, modulation of independent variability (at the level predicted if changes in Fano factor were due solely to changes in independent variability) accounted for 4% of the observed attentional improvement, rate accounted for 9%, correlation accounted for 79%, and the three together accounted for 95%. D. Average proportion of actual attentional improvement for all 82 data sets. Each day of data contributed two data sets (one for each hemisphere). Error bars represent SEM. All proportions are statistically different from zero (t-test, p<0.01) except the independent variability-only simulation (p=0.82). E. Population sensitivity as a function of the number of neurons involved in the task. Population d′ was calculated using the method described in A and B except that data in both the attended and the unattended conditions were simulated. For each population size, we sampled, with replacement, from the entire population of neurons from all data sets combined. Each simulation was run 100 times for 10,000 trials on each run. The inset plots the relative contribution of each factor (which is the ratio of the improvement in d′ for that factor alone to the improvement in d′ for all three factors) as a function of population size. Correlation is the most important factor for population sizes greater than 5 (crossing of the green and blue lines).

Similar articles

Cited by

References

    1. Yantis S, Serences JT. Cortical mechanisms of space-based and object-based attentional control. Curr Opin Neurobiol. 2003;13:187–193. - PubMed
    1. Assad JA. Neural coding of behavioural relevance in parietal cortex. Curr Opin Neurobiol. 2003;13:194–197. - PubMed
    1. Reynolds JH, Chelazzi L. Attentional modulation of visual processing. Annu Rev Neurosci. 2004;27:611–647. - PubMed
    1. Maunsell JH, Treue S. Feature-based attention in visual cortex. Trends Neurosci. 2006;29:317–322. - PubMed
    1. Tolhurst DJ, Movshon JA, Dean AF. The statistical reliability of signals in single neurons in cat and monkey visual cortex. Vision Res. 1983;23:775–785. - PubMed

Publication types