. 2009 Dec;4(12):855-60.
doi: 10.1038/nnano.2009.333. Epub 2009 Nov 15.

In vivo magnetic enrichment and multiplex photoacoustic detection of circulating tumour cells

Affiliations

In vivo magnetic enrichment and multiplex photoacoustic detection of circulating tumour cells

Ekaterina I Galanzha et al. Nat Nanotechnol. 2009 Dec.

Abstract

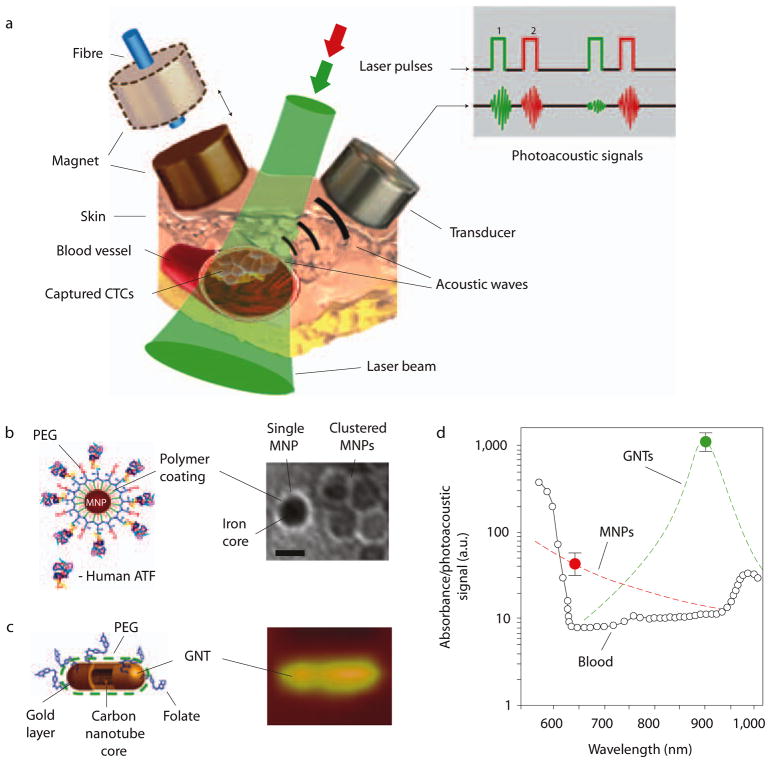
The spread of cancer cells between organs, a process known as metastasis, is the cause of most cancer deaths. Detecting circulating tumour cells -- a common marker for the development of metastasis -- is difficult because ex vivo methods are not sensitive enough owing to limited blood sample volume and in vivo diagnosis is time-consuming as large volumes of blood must be analysed. Here, we show a way to magnetically capture circulating tumour cells in the bloodstream of mice followed by rapid photoacoustic detection. Magnetic nanoparticles, which were functionalized to target a receptor commonly found in breast cancer cells, bound and captured circulating tumour cells under a magnet. To improve detection sensitivity and specificity, gold-plated carbon nanotubes conjugated with folic acid were used as a second contrast agent for photoacoustic imaging. By integrating in vivo multiplex targeting, magnetic enrichment, signal amplification and multicolour recognition, our approach allows circulating tumour cells to be concentrated from a large volume of blood in the vessels of tumour-bearing mice, and this could have potential for the early diagnosis of cancer and the prevention of metastasis in humans.


Figures

Figure 1
Figure 1. In vivo magnetic enrichment using two-colour photoacoustic detection of CTCs
a, Schematic showing the detection setup. The laser beam is delivered either close to the external magnet or through a hole in the magnet using a fibre-based delivery system. b, Schematic (left) and transmission electron microscopy image (right) of MNPs, each with a 10-nm core, a thin (~2 nm) layer of amphiphilic triblock copolymers modified with short polyethylene glycol (PEG) chains and the amino-terminal fragment (ATF) of the urokinase plasminogen activator. Scale bar, 10 nm. c, Schematic (left) and topographic atomic force microscopy image (right) of a GNT (12 nm × 98 nm) coated with PEG and folic acid. d, Photoacoustic spectra of ~70-mm veins in mouse ear (open circles). The average standard deviation for each wavelength is 18%. Absorption spectra of MNPs and GNTs (dashed red and green curves) are normalized to photoacoustic signals from CTCs labelled with MNPs (filled red circle) and GNTs (filled green circle).
Figure 2
Figure 2. In vitro measurement under stationary conditions
a, Prussian blue staining of MDA-MB-231 cells incubated with non-conjugated MNPs (left) and amino-terminal fragment MNPs (right) for 2 h at 37°C. b, Fluorescence images of a single cell incubated with FITC–GNTs (left) and folate–FITC–GNTs (right) for 30 min at 37 °C. c, Photoacoustic signals from 10-nm MNPs (~1×10¹¹ nanoparticles ml−1) without a magnet (red curve with filled squares) and a single MNP-labelled cell in a suspension placed on a 120-μm-thick microscope slide with (blue curve with filled circles) and without (green curve with open circles) a magnet. The average standard deviation for each laser fluence is 32%. d, Photoacoustic signals from nanoparticles at different concentrations. The background level is from mouse blood. The error bars represent standard error.
Figure 3
Figure 3. In vitro measurement under flow conditions
a, Schematic showing the in vitro testing tube. b–d, Magnetic capturing of MNP-labelled cancer cells in PBS at a flow velocity of 5 mm s−1 (b) and of labelled cancer cells in the presence of free MNPs at 0.1 cm s−1 (c) and 5 cms−1 (d). e,f, Photoacoustic signals from captured cells (e) and surrounding medium (f) in b. Amplitude/time scales: 500 mV/div and 4 ms/div (e) and 50mV/div and 4 ms/div (f). g, Capturing efficiency of MNP-labelled cells and free MNPs calculated as the relative amount of captured cells and MNPs using the optical images in Fig. 3b–d and Supplementary Fig. S6–b d at different flow velocities normalized to those at a velocity of 0.1 cm s−1. The average standard deviation for each velocity is 26%. The error bars represent the standard error.
Figure 4
Figure 4. In vivo measurements of nanoparticles and cells mimicking CTCs
a, Kinetics of clearance of 30-nm MNPs (red curve with filled circles) and GNTs (blue curve with open circles) at a concentration of 1×10¹¹ nanoparticles ml−1 in a ~70-mm mouse ear vein. b, Photoacoustic monitoring of CTCs in the abdominal vessel using fibre-based photoacoustic flow cytometry. The graph shows the clearance for cells that were labelled with the nanoparticle cocktail in vitro before injection (green curve with filled circles) and those labelled with the nanoparticle cocktail in vivo after sequential injections of unlabelled cells alone and then nanoparticles alone (red curve with open circles). GNT/MNP cocktails had a GNT/MNP ratio of 20:80 in 10ml PBS (n=3). The average standard deviation for each wavelength is 28%. c–e, Typical photoacoustic signals at different wavelengths from CTCs labelled with MNPs and GNTs (c), GNTs only (d) and MNPs only (e). f, Photoacoustic signals from blood vessels only. The error bars in a and b represent standard error.
Figure 5
Figure 5. Photoacoustic detection and magnetic enrichment of CTCs in tumour-bearing mice
a, The size of the primary breast cancer xenografts at different stages of tumour development. b, The average rate of CTCs in mouse ear vein over a period of several weeks. c, Photoacoustic signals from CTCs in abdominal skin vessels obtained with fibre schematics at week 1 of tumour development before and after magnet action. The average standard deviation for each wavelength is 24%. d, Photoacoustic signals from CTCs in abdominal skin vessels before, during (3 min) and after magnetic action at week 2 of tumour development. The error bars in b and d represent standard error.

Comment in

Similar articles

Cited by

References

    1. Christofori G. New signals from the invasive front. Nature. 2006;441:444–450. - PubMed
    1. Pantel K, Brakenhoff RH, Brandt B. Detection, clinical relevance and specific biological properties of disseminating tumour cells. Nature Rev Cancer. 2008;8:329–340. - PubMed
    1. Nagrath S, et al. Isolation of rare circulating tumor cells in cancer patients by microchip technology. Nature. 2007;450:1235–1239. - PMC - PubMed
    1. Riethdorf S, et al. Detection of circulating tumor cells in peripheral blood of patients with metastatic breast cancer: a validation study of the CellSearch system. Clin Cancer Res. 2007;13:920–928. - PubMed
    1. Georgakoudi I, et al. In vivo flow cytometry: a new method for enumerating circulating cancer cells. Cancer Res. 2004;64:5044–5047. - PubMed

Publication types