. 2009 Nov 13;4(11):e7752.
doi: 10.1371/journal.pone.0007752.

Glioblastoma subclasses can be defined by activity among signal transduction pathways and associated genomic alterations

Affiliations

Glioblastoma subclasses can be defined by activity among signal transduction pathways and associated genomic alterations

Cameron Brennan et al. PLoS One. .

Abstract

Background: Glioblastoma multiforme (GBM) is an umbrella designation that includes a heterogeneous group of primary brain tumors. Several classification strategies of GBM have been reported, some by clinical course and others by resemblance to cell types either in the adult or during development. From a practical and therapeutic standpoint, classifying GBMs by signal transduction pathway activation and by mutation in pathway member genes may be particularly valuable for the development of targeted therapies.

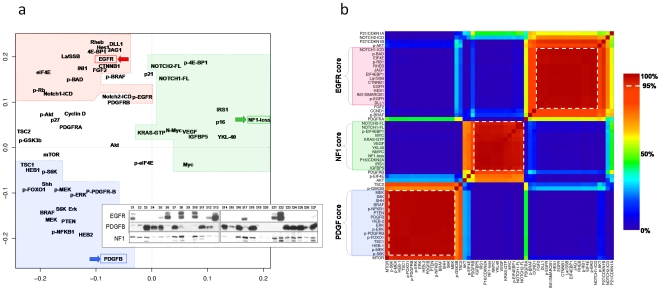
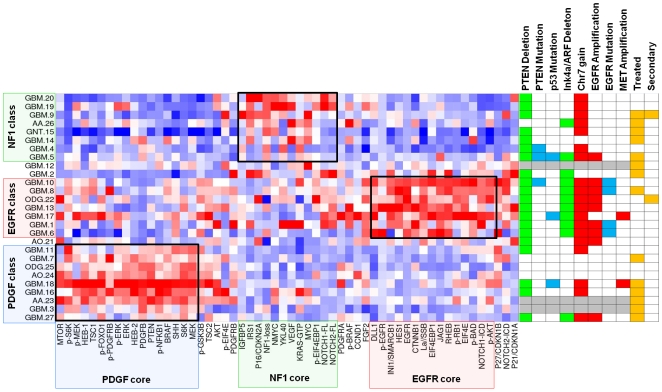
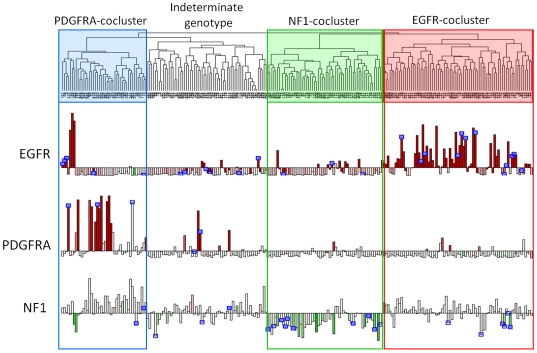
Methodology/principal findings: We performed targeted proteomic analysis of 27 surgical glioma samples to identify patterns of coordinate activation among glioma-relevant signal transduction pathways, then compared these results with integrated analysis of genomic and expression data of 243 GBM samples from The Cancer Genome Atlas (TCGA). In the pattern of signaling, three subclasses of GBM emerge which appear to be associated with predominance of EGFR activation, PDGFR activation, or loss of the RAS regulator NF1. The EGFR signaling class has prominent Notch pathway activation measured by elevated expression of Notch ligands, cleaved Notch receptor, and downstream target Hes1. The PDGF class showed high levels of PDGFB ligand and phosphorylation of PDGFRbeta and NFKB. NF1-loss was associated with lower overall MAPK and PI3K activation and relative overexpression of the mesenchymal marker YKL40. These three signaling classes appear to correspond with distinct transcriptomal subclasses of primary GBM samples from TCGA for which copy number aberration and mutation of EGFR, PDGFRA, and NF1 are signature events.

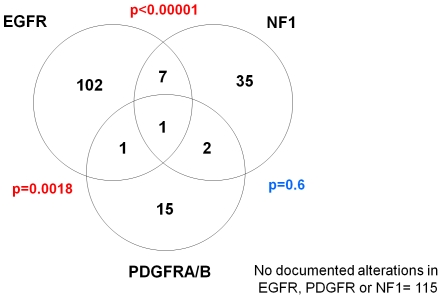
Conclusions/significance: Proteomic analysis of GBM samples revealed three patterns of expression and activation of proteins in glioma-relevant signaling pathways. These three classes are comprised of roughly equal numbers showing either EGFR activation associated with amplification and mutation of the receptor, PDGF-pathway activation that is primarily ligand-driven, or loss of NF1 expression. The associated signaling activities correlating with these sentinel alterations provide insight into glioma biology and therapeutic strategies.


Conflict of interest statement

Competing Interests: The authors have declared that no competing interests exist.

Figures

Figure 1
Figure 1. Analysis of quantified western data in 20 GBM identifies three signaling axes associated with EGFR overexpression, PDGFB overexpression, and loss of NF1.
(A) Principal component analysis (PCA) of 56 proteins in 20 GBM samples by quantified western blot (see Methods). The first two components are plotted, accounting for 51% of variance in protein levels. PC2 strongly distinguishes proteins correlated with EGFR (red arrow) versus PDGFB (blue), while PC1 distinguishes a third pattern which is correlated with neither of these RTK pathways. Of note, NF1 appears to be silenced in this group (“NF1 loss”, zero minus standardized protein expression, green). Dashed lines bound proteins with significant co-expression by k-means clustering (see B). Inset shows the western bands confirming mutual exclusivity for EGFR expression, PDGFB expression and NF1 silencing. (B) K-means clustering of proteins confirms three statistically significant core clusters. Unsupervised k-means clustering of quantified protein levels in 20 GBM reveals 3 patterns of coordinate protein expression. The consensus matrix shown represents how often two proteins were co-clustered during 10,000 iterations, leaving out 15% of samples (n = 3) selected at random for each iteration. “Core” correlated proteins are those that show >95% co-clustering across iterations (dashed-lines). These define an EGFR group, a PDGFB group and a third non-EGFR/PDGF group which features NF1 loss. 3-way clustering was determined to be the best fit by consensus matrix stability and cophenetic correlation (see text, Figure S2).
Figure 2
Figure 2. K-means clustering of gliomas by signature-defining proteins.
Unsupervised k-means clustering of 27 gliomas by 44 core proteins derived from Figure 1B. 3-way clustering was determined to be the best fit by consensus matrix stability and cophenetic correlation (3). Right: summary of array-CGH, sequencing and clinical information is given for each tumor. Red denotes copy number gain or focal amplification as specified; green marks deletion of at least one copy. Blue denotes mutations (see text). Gray marks samples for which DNA was unavailable. Detailed aCGH profiles shown in Figure S4.
Figure 3
Figure 3. Integration of mutation and chromosomal copy number data from TCGA reveals aberrations of EGFR to be mutually exclusive of aberrations in PDGFRA and NF1.
Summary of copy number aberrations (CNA) and mutations of EGFR, PDGFR and NF1 genes in 278 glioblastoma samples from The Cancer Genome Atlas. 163 samples showed mutation/aberration of at least one of the genes. For this summary, only validated, non-synonymous somatic mutations were considered (164/278 samples had sequencing information available). CNA was defined as focal high-amplitude amplification (>4 copies) of EGFR or PDGFR, and by at least single-copy loss of NF1.
Figure 4
Figure 4. Unsupervised transcriptomal clustering of GBM from the TCGA dataset.
Unsupervised hierarchical clustering of gene expression from 243 GBM samples in The Cancer Genome Atlas reveals four transcriptomal clusters, three of which are enriched for alterations of PDGFRA, NF1, and EGFR respectively. Expression data is from Affymetrix U133A and copy number is taken from Agilent 244K platform (TCGA Level 3 public data, see Methods). Gene expression for EGFR, PDGFRA, and NF1 is shown in the bar plots, colored according to gene copy number: amplification (red) or loss (green). Blue boxes denote samples with non-synonymous somatic mutations which have been validated (solid) or are pending validation (open). Three clusters are highlighted which show specific enrichment for lesions in genes encoding key signal transduction pathway members EGFR, PDGFRA and NF1. A fourth cluster lacks clear enrichment for any specific mutation or CNA.

References

    1. Furnari FB, Fenton T, Bachoo RM, Mukasa A, Stommel JM, et al. Malignant astrocytic glioma: genetics, biology, and paths to treatment. Genes Dev. 2007;21:2683–2710. - PubMed
    1. Holland EC. Glioblastoma multiforme: the terminator. Proc Natl Acad Sci U S A. 2000;97:6242–6244. - PMC - PubMed
    1. Wen PY, Kesari S. Malignant gliomas in adults. N Engl J Med. 2008;359:492–507. - PubMed
    1. Maher EA, Furnari FB, Bachoo RM, Rowitch DH, Louis DN, et al. Malignant glioma: genetics and biology of a grave matter. Genes Dev. 2001;15:1311–1333. - PubMed
    1. Louis DN, Ohgaki H, Wiestler OD, Cavenee WK, Burger PC, et al. The 2007 WHO classification of tumours of the central nervous system. Acta Neuropathol. 2007;114:97–109. - PMC - PubMed

Publication types