. 2009 Nov 12;4(11):e7815.
doi: 10.1371/journal.pone.0007815.

Genotyping of genetically monomorphic bacteria: DNA sequencing in Mycobacterium tuberculosis highlights the limitations of current methodologies

Affiliations

Genotyping of genetically monomorphic bacteria: DNA sequencing in Mycobacterium tuberculosis highlights the limitations of current methodologies

Iñaki Comas et al. PLoS One. .

Abstract

Because genetically monomorphic bacterial pathogens harbour little DNA sequence diversity, most current genotyping techniques used to study the epidemiology of these organisms are based on mobile or repetitive genetic elements. Molecular markers commonly used in these bacteria include Clustered Regulatory Short Palindromic Repeats (CRISPR) and Variable Number Tandem Repeats (VNTR). These methods are also increasingly being applied to phylogenetic and population genetic studies. Using the Mycobacterium tuberculosis complex (MTBC) as a model, we evaluated the phylogenetic accuracy of CRISPR- and VNTR-based genotyping, which in MTBC are known as spoligotyping and Mycobacterial Interspersed Repetitive Units (MIRU)-VNTR-typing, respectively. We used as a gold standard the complete DNA sequences of 89 coding genes from a global strain collection. Our results showed that phylogenetic trees derived from these multilocus sequence data were highly congruent and statistically robust, irrespective of the phylogenetic methods used. By contrast, corresponding phylogenies inferred from spoligotyping or 15-loci-MIRU-VNTR were incongruent with respect to the sequence-based trees. Although 24-loci-MIRU-VNTR performed better, it was still unable to detect all strain lineages. The DNA sequence data showed virtually no homoplasy, but the opposite was true for spoligotyping and MIRU-VNTR, which was consistent with high rates of convergent evolution and the low statistical support obtained for phylogenetic groupings defined by these markers. Our results also revealed that the discriminatory power of the standard 24 MIRU-VNTR loci varied by strain lineage. Taken together, our findings suggest strain lineages in MTBC should be defined based on phylogenetically robust markers such as single nucleotide polymorphisms or large sequence polymorphisms, and that for epidemiological purposes, MIRU-VNTR loci should be used in a lineage-dependent manner. Our findings have implications for strain typing in other genetically monomorphic bacteria.


Conflict of interest statement

Competing Interests: The authors have declared that no competing interests exist.

Figures

Figure 1
Figure 1. Schematic illustrating the principles of the CRISPR- and VNTR-based genotyping in MTBC.
These genotyping methods are known as ‘spoligotyping’ and ‘MIRU-VNTR-typing’, respectively. Spoligotyping is based on the detection of 43 unique spacers located between direct repeats at a specific locus of the MTBC genome known as the direct repeat (DR) locus. Spoligotyping patterns are commonly represented by black and white squares indicating presence or absence of particular spacers, respectively. The deletion of some of these 43 spacers allows to differentiate between strains. MIRU-VNTR analysis relies on the identification of different number of repeats at several loci scattered around the bacterial genome (marked by A, B, C, and D in the figure). The number of repeats at each locus is combined to generate a unique numerical code used to establish phylogenetic and epidemiological links between strains.
Figure 2
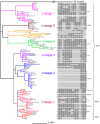
Figure 2. Maximum parsimony phylogeny based on concatenates of 89 gene sequences from 108 MTBC strains from global sources as previously reported .
Six main lineages can be observed within the human MTBC (numbered 1 to 6 and indicated in different colours). As shown previously, these lineages are highly congruent to the ones defined based on genomic deletions or large sequence polymorphisms (LSPs) , , . Corresponding spoligotyping data for each strain are shown on the right, where black squares indicate the presence of a particular spacer and a white square the absence of a particular spacer (see Figure 1 for details on the methodology). Because the various typing techniques have classified MTBC strains into several lineages and strain families using differing nomenclatures, some of the traditional names are also shown. Some of the traditional groupings defined by spoligotyping correlate with SNP-based lineages (see also Table S1). For example, EAI (East-African-Indian) corresponds to the pink lineage, AFR1 and AFR2 correspond to the green and brown lineage, respectively (these strains are also known as M. africanum), and CAS (Central-Asian) corresponds to the purple lineage. However, other strain groupings defined by spoligotyping should be regarded as sub-lineages within the main lineages. For example, the ‘Beijing’ strain family is part of the blue lineage, and the five spoligotyping groups ‘Cameroon’, ‘Uganda’ ‘X’, ‘Haarlem’, and ‘LAM (Latin-American-Mediterranean)’ are sub-lineages within the main red lineage. This highlights another limitation of spoligotyping, which is that phylogenetic relationships between strain groupings cannot be defined. In addition, asterisks indicate spoligotyping patterns that cannot be classified at all using standard ‘signature patterns’ . PGG1, PGG2, and PGG3 indicate Principal Genetic Group 1, 2, and 3, respectively. The PGG nomenclature is based on two SNPs originally described by Sreevatsan at al. . Comparison to the MLSA data shows these groups are not phylogenetically equivalent as most of the MTBC diversity groups within PGG1, and PGG3 includes only a small subset of strains.
Figure 3
Figure 3. Comparison of unrooted phylogenies of MTBC based on 97 global strains using various molecular markers.
Colours indicate the main MTBC lineages as defined by MLSA and LSPs . (A) Neigbour-joining (NJ) phylogeny based on 339 variable nucleotide positions in 89 genes using number of SNPs as distance. The same topology was obtained using NJ, Maximum likelihood (ML), and Bayesian inference (BI). Numbers indicate bootstrap support after 1,000 pseudoreplicates for NJ and ML, and a posteriori probabilities for BI, respectively (Figure S1). MTBC can be divided in two main clades, one evolutionary ‘modern’ (also known as ‘TbD1-negative’), which includes the blue, purple, and red strain lineages, and one evolutionary ‘ancient’ (TbD-positive), which includes the remaining strain lineages. (B) NJ phylogeny based on spoligotyping data and Jaccard distances. No bootstrap values could be calculated using these markers. (C) NJ phylogeny based on 15-loci-MIRU-VNTR data and Nei distances. Numbers indicate bootstrap support after 1,000 pseudoreplicates. (D) NJ phylogeny based on 24-loci-MIRU-VNTR data and Nei distances. Numbers indicate bootstrap support after 1,000 pseudoreplicates.
Figure 4
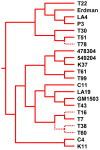
Figure 4. One example of homoplasy in the MIRU-VNTR-based phylogeny for the red strain lineage.
The SNP C→G is shared by the strains T60, T38, T16, and T78 (dashed branches). These strains form a monophyletic group in the MLSA phylogeny (Figure 2). By contrast, the MIRU-VNTR-based topology splits these strains into three artificial groups, implying the same C→G change occurred three times independently.
Figure 5
Figure 5. Comparison of the homoplasy index (HI) across the different genotyping methods.
HI was calculated based on the number of observed changes at each character compared to the expected number of changes assuming absence of homoplasy. Figure S3 shows several examples of homoplasy for individual MIRU-VNTR loci where the same number of repeats appear in unrelated branches of the tree.
Figure 6
Figure 6. Measure of discriminatory power (HGI) of individual MIRU-VNTR loci by MLSA-defined MTBC strain lineage.
Red lines indicate HGI thresholds for highly discriminatory loci (HGI≥0.6, continuous), and intermediate discriminatory loci (HGI≥0.3, dashed), as previously defined . Asterisks indicate MIRU-VNTR loci that have been proposed for standard molecular epidemiological typing of MTBC . See also Table S3.
Figure 7
Figure 7. Number of discriminatory MIRU-VNTR loci (HGI≥0.3) as a function of intra-lineage nucleotide diversity (Pi).
The number next to the lineage designation indicates the number of strains analyzed for each MTBC lineage.

Similar articles

Cited by

References

    1. Achtman M. Evolution, population structure, and phylogeography of genetically monomorphic bacterial pathogens. Annu Rev Microbiol. 2008;62:53–70. - PubMed
    1. Achtman M, Zurth K, Morelli G, Torrea G, Guiyoule A, et al. Yersinia pestis, the cause of plague, is a recently emerged clone of Yersinia pseudotuberculosis. Proc Natl Acad Sci U S A. 1999;96:14043–14048. - PMC - PubMed
    1. Holt KE, Parkhill J, Mazzoni CJ, Roumagnac P, Weill FX, et al. High-throughput sequencing provides insights into genome variation and evolution in Salmonella Typhi. Nat Genet. 2008;40:987–993. - PMC - PubMed
    1. Van Ert MN, Easterday WR, Huynh LY, Okinaka RT, Hugh-Jones ME, et al. Global genetic population structure of Bacillus anthracis. PLoS ONE. 2007;2:e461. - PMC - PubMed
    1. Monot M, Honore N, Garnier T, Araoz R, Coppee JY, et al. On the origin of leprosy. Science. 2005;308:1040–1042. - PubMed

Publication types