. 2009 Nov 13;4(11):e7830.
doi: 10.1371/journal.pone.0007830.

Filamins regulate cell spreading and initiation of cell migration

Affiliations

Filamins regulate cell spreading and initiation of cell migration

Massimiliano Baldassarre et al. PLoS One. .

Abstract

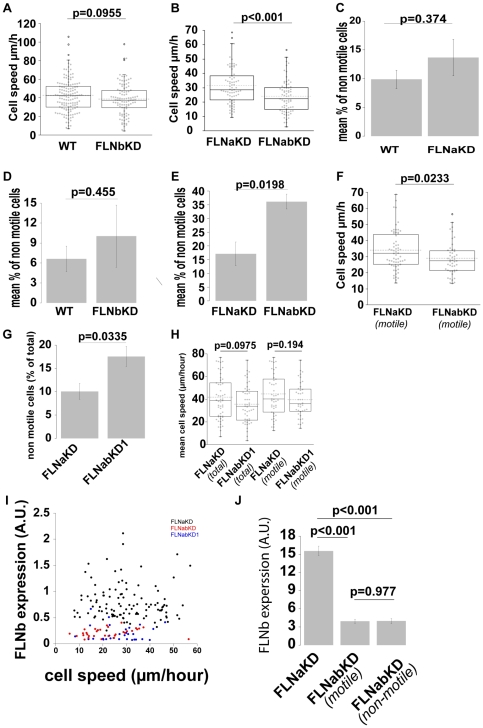
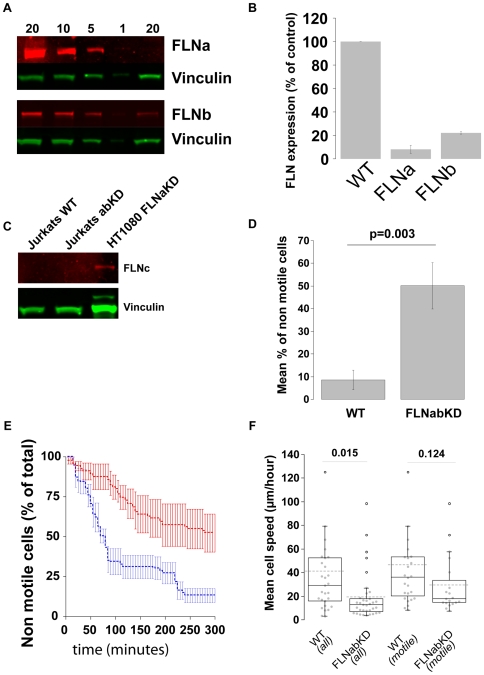
Mammalian filamins (FLNs) are a family of three large actin-binding proteins. FLNa, the founding member of the family, was implicated in migration by cell biological analyses and the identification of FLNA mutations in the neuronal migration disorder periventricular heterotopia. However, recent knockout studies have questioned the relevance of FLNa to cell migration. Here we have used shRNA-mediated knockdown of FLNa, FLNb or FLNa and FLNb, or, alternatively, acute proteasomal degradation of all three FLNs, to generate FLN-deficient cells and assess their ability to migrate. We report that loss of FLNa or FLNb has little effect on migration but that knockdown of FLNa and FLNb, or proteolysis of all three FLNs, impairs migration. The observed defect is primarily a deficiency in initiation of motility rather than a problem with maintenance of locomotion speed. FLN-deficient cells are also impaired in spreading. Re-expression of full length FLNa, but not re-expression of a mutated FLNa lacking immunoglobulin domains 19 to 21, reverts both the spreading and the inhibition of initiation of migration.Our results establish a role for FLNs in cell migration and spreading and suggest that compensation by other FLNs may mask phenotypes in single knockout or knockdown cells. We propose that interactions between FLNs and transmembrane or signalling proteins, mediated at least in part by immunoglobulin domains 19 to 21 are important for both cell spreading and initiation of migration.


Conflict of interest statement

Competing Interests: The authors have declared that no competing interests exist.

Figures

Figure 1
Figure 1. Generation of FLNaKD cells.
A) FLNa and FLNb expression in FLNaKD cells was quantified comparing 10 µg of cell lysate to a curve of cell lysates prepared from HT1080 WT cells. Vinculin expression was used as loading control. The bar chart depicts average of 4 independent western blots normalized to control ± SEM. B) HT1080 WT or FLNaKD were plated on 5 µg/ml FN coated coverslips overnight, fixed, permeabilized and stained with anti-FLNa (FLNa), anti-FLNb (FLNb), phalloidin (phall) and DAPI (shown in blue in the merged image). Bar = 20 µm. C) HT1080 WT and HT1080 FLNaKD cells were detached, mixed and seeded on a 3.5 cm petri dish coated with 5 µg/ml FN, allowed to adhere and spread. Cells were fixed after 1 hour and stained with anti-FLNa to discriminate between WT and FLNaKD cells. The area was measured by manually rendering the cell contour in the phase images. 1 pixel2 = 1.664 µm2 (Sample size WT = 74; FLNaKD = 82 from 5 independent experiments). Error bars show SEM. D) Integrin beta1 present on the membrane surface of WT and FLNaKD cells. The left panel show histogram a representative histogram plot, the right panel shows the average of 4 experiments ± standard deviation.
Figure 2
Figure 2. FLNaKD cells in random cell migration assay.
A) Flow chart of the time-lapse experiments. Cells were suspended, washed, and control and knockdown cells mixed before seeding onto FN-coated plates. 10 minutes after plating unattached cells were washed away and imaging was initiated 1 hour after plating. At the end of the time-lapse recording, cells were fixed and stained for FLNa expression. WT cells are outlined in white, FLNaKD cells in green. B) Schematic diagram of migration parameters. Cell is considered migratory if max d>25 (average cell radius); final speed = Total cell path/tend; directionality  = dend/Total cell path. C) Comparison of cell area at the start and at the end of time-lapse recording. 1 square pixel2 = 1.664 µm2. Dots plot shows the overall population distribution (sample size: WT = 74; FLNaKD = 82; from 5 independent experiments), dotted line shows the mean, box and whiskers plots show quartiles. P values were calculated using a paired t-test. D) Speed of HT1080 WT and FLNaKD (sample size WT = 38; FLNaKD = 41; from 4 independent experiments). E) Directionality (defined as dend/total cell path) comparison between HT1080 WT and FLNaKD (sample size: WT = 29; FLNa = 33; from 3 independent experiments). F) Circularity (as defined in ImageJ = 4π(area/perimeter2) comparisons between HT1080 WT and FLNaKD cells 6 hours after plating (sample size: WT = 49; FLNaKD = 83; from 4 independent experiments).
Figure 3
Figure 3. Generation of FLNabKD cells.
A) FLNa and FLNb protein expression was quantified comparing 10 µg of cell lysate prepared from FLNaKD, FLNbKD and FLNabKD cells to a curve of cell lysates prepared from HT1080 WT lysates. Vinculin and actin were used as loading control. B) Quantification of FLNa and FLNb protein expression; bars show mean value normalized to control ±SEM (n = 4). C) Integrin beta1 present on the membrane surface of WT, FLNbKD and FLNabKD cells. The left panel shows a representative histogram plot, the right panel shows the average of 4 experiments ± standard deviation. D) HT1080WT, FLNbKD or FLNabKD cells were plated on FN-coated coverslips, incubated overnight, fixed, permeabilized and stained with anti-FLNa (FLNa), anti-FLNb (FLNb) or phalloidin (phall). Bar = 20 µm.
Figure 4
Figure 4. FLNabKD cells exhibit spreading defects.
A,B) FLNaKD and FLNabKD (A) or HT1080 WT and FLNbKD (B) cells were mixed and plated on FN-coated plates. After 6 hours cells were fixed and stained with anti-FLNb to discriminate between the two populations. The area was measured by manually rendering the cell contour in the phase contrast. (Sample size: FLNaKD = 85; FLNabKD = 89 from 5 experiments; WT = 76; FLNbKD = 59 from 3 independent experiments) 1 pixel2 = 1.664 µm2. Error bars show SEM. C) FLNabKD cells were transfected with FLNa*-GFP. 24 hours later cells were detached, replated and allowed to adhere and spread as described in A and B. After fixation cells were stained with anti-FLNa to identify FLNa* expressing cells (sample size: ≥10 from 6 independent experiments). 1 pixel2 = 1.664 µm2. Error bars show SEM. D) Comparison of cell area at the start and end of time-lapse recording. 1 pixel2 = 1.664 µm2. Dot plot shows the overall population distribution (sample size = 213; from 10 independent experiments) dotted line shows the mean value, box and whiskers plots show quartiles. P values were calculated using a paired t-test. E) HT1080 WT and FLNabKD cells were plated on plates coated with 5 µg/ml FN, and analyzed in high resolution time-lapse (1 frame/minute) 5 minutes after the plating. Values are shown as the average % of the maximum cell area ±SEM (sample size: WT = 12; FLNabKD = 9 from 3 independent experiments).
Figure 5
Figure 5. FLNs play a role in initiation of cell migration.
A,B,F and H) Speed of HT1080 WT and FLNbKD (A), FLNaKD and FLNabKD (B), FLNaKD(motile) and FLNabKD(motile) (F), or FLNaKD and FLNabKD1 (H) were compared in time-lapse migration assays. Dot plot shows the overall population distribution (sample size: WT = 137; FLNbKD = 99; FLNaKD = 74 in B and 53 in H; FLNabKD = 71; FLNabKD1 = 48; at least 4 independent experiments were performed for each pair), dotted line shows the mean value, box and whiskers plots show quartiles. C,D,E and G) % of non motile cells in the time lapse experiments expressed as mean ± SEM. I) relation between cell speed and FLNb expression in FLNaKD (black dots), FLNabKD (red dots) and FLNabKD1 (blue dots). J) FLNb content of FLNaKD, FLNabKD motile and FLNabKD non-motile cells. Total fluorescence of FLNb staining was measured at the end of time-lapse recording. Bars show mean value ±SEM (sample size: FLNaKD = 58; FLNabKDmotile = 22; FLNabKDnon-motile = 15 from 3 independent experiments).
Figure 6
Figure 6. FLNa* but not FLNa*Δ19–21 rescues motility of FLNabKD cells.
A and B) FLNabKD cells were transfected with FLNa*-GFP and assessed in time-lapse migration assays. Re-expressing cells were identified by staining for FLNa. Mean % of non-motile cells (A) and mean cell speed (B) in untransfected and FLNa-re-expressing FLNabKD cells. Values ±SEM from at least 4 independent experiments: sample size FLNabKD = 75; FLNabKD+FLNa* = 9). C and D) FLNabKD cells were transfected with FLNaΔ19–21 and assessed in time-lapse migration assays. Cells expressing FLNaΔ19–21 were identified by staining for FLNa. Mean cell area was measured by manually rendering the cell contour in the phase contrast (C) and motility assessed as described previously (D). Values ± SEM from at least 4 independent experiments: (sample size FLNabKD = 94; FLNabKD+FLNa*Δ19–21 = 10). 1 pixel2 = 1.664 µm2.
Figure 7
Figure 7. HT1080 express FLNc.
A) Cell lysates from HEK 293 cells or HEK cells expressing FLNa-GFP, FLNb-GFP or FLNc-GFP were probed by an anti-FLNc antibody (upper panel) or an anti-GFP antibody (lower panel). B) 30 µg of lysates from the indicated cell lines were probed for FLNc content (red signal) and vinculin (green signal) used as loading control. C) Cell lysates were fractionated by SDS-PAGE and gels stained for total protein. The extent of staining of a band of approximately 280 kDa (marked with an asterisk) that co-migrates with bands detected by anti-FLNa antibodies was measured. Bars show the results from 5 experiments (mean ± SEM). D) Estimation of total FLN levels in HT1080 WT. E) HT1080 WT cells were co-transfected with FLNa-GFP (left panel), FLNb-GFP (middle panel), or FLNc-GFP (right panel) and GFP, GFP-ASB2α or GFP-ASB2αΔ as indicated. 24 hours after transfection cells were lysed, and analysed by western blotting for GFP. Vinculin staining was used as loading control. F) HT1080 FLNaKD cells were transfected with either GFP-ASB2α or GFP-ASB2αΔ. 20 hours after transfection cells were lysed and analysed by western blotting for FLNc and GFP. Vinculin was used as loading control.
Figure 8
Figure 8. ASB2α inhibits initiation of cell migration without affecting cell speed.
A) HT1080 transfected with GFP-ASB2α (left panel) or GFP-ASB2αΔ (right panel) were detached after 20 hours and fixed 6 hours after re-plating on 5 µg/ml FN and stained for FLNa or FLNb. B) Percent of non-motile cells in the time-lapse recording expressed as mean ± SEM (6 experiments for ASB2α; 3 for ASB2αΔ). C) HT1080 ASB2α expressing or non-expressing cells (NE) were stained at the end of time lapse experiments to measure FLNa content in motile and non motile cells (sample size NE = 20; ASB2α-motile = 12; ASB2α non motile = 17; from 3 independent experiments). D) HT1080 ASB2α expressing (blue line) or non-expressing (black line) cells were recorded for 15 hours at 1 frame/5 minutes and the mean percent of non motile cells at each time point plotted. (Sample size: NE = 43; ASB2α = 13; from 2 independent experiments). E) Speed of HT1080 ASB2α expressing or non-expressing cells: total population (left) or migratory population (right). (Sample size: NE all = 75; ASB2α all = 39; NE motile = 51; ASB2α motile = 19; from 6 independent experiments).
Figure 9
Figure 9. FLNs play a role in initiation of cell migration in Jurkat cells.
A) FLNa and FLNb protein expression was quantified comparing 20 µg of cell lysate prepared from Jurkat FLNabKD cells to a curve of cell lysates prepared from Jurkat WT lysates. Vinculin was used as loading control. B) Quantification of FLNa and FLNb protein expression; bars show mean value normalized to control ±SEM (n = 4). C) 20 µg of a cell lysate from Jurkat WT or Jurkat FLNabKD was probed for FLNc content, 20 µg of lysate from HT1080 FLNabKD cells was used as positive control. D) Percent of non-motile cells in the time-lapse recording expressed as mean ± SEM (from 6 independent experiments). E) Percent of non-motile cells were analysed at each time point in 5 experiments and the average ± SEM is plotted. Blue line shows Jurkat WT cells red line Jurkat FLNabKD cells. F) Speed of Jurkat WT and FLNabKD cells: total population (left) or migratory population (right). (Sample size: WT all = 29; FLNabKD all = 35; WT motile = 25; FLNabKD motile = 19; from 6 independent experiments).

References

    1. Vicente-Manzanares M, Webb DJ, Horwitz AR. Cell migration at a glance. J Cell Sci. 2005;118 - PubMed
    1. Ridley AJ, Schwartz MA, Burridge K, Firtel RA, Ginsberg MH, et al. Cell migration: integrating signals from front to back. Science. 2003;302:1704–1709. - PubMed
    1. Pollard TD, Borisy GG. Cellular motility driven by assembly and disassembly of actin filaments. Cell. 2003;112:453–465. - PubMed
    1. Gorlin JB, Yamin R, Egan S, Stewart M, Stossel TP, et al. Human endothelial actin-binding protein (ABP-280, nonmuscle filamin): A molecular leaf spring. J Cell Biol. 1990;111:1089–1105. - PMC - PubMed
    1. Stossel TP, Condeelis J, Cooley L, Hartwig JH, Noegel A, et al. Filamins as integrators of cell mechanics and signalling. Nat Rev Mol Cell Biol. 2001;2:138–145. - PubMed

Publication types