. 2009 Nov 13;4(11):e7757.
doi: 10.1371/journal.pone.0007757.

Ablation of arginylation in the mouse N-end rule pathway: loss of fat, higher metabolic rate, damaged spermatogenesis, and neurological perturbations

Affiliations

Ablation of arginylation in the mouse N-end rule pathway: loss of fat, higher metabolic rate, damaged spermatogenesis, and neurological perturbations

Christopher S Brower et al. PLoS One. .

Abstract

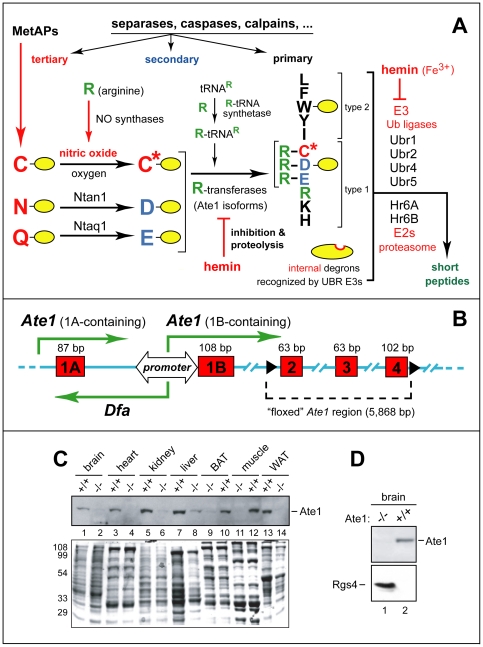
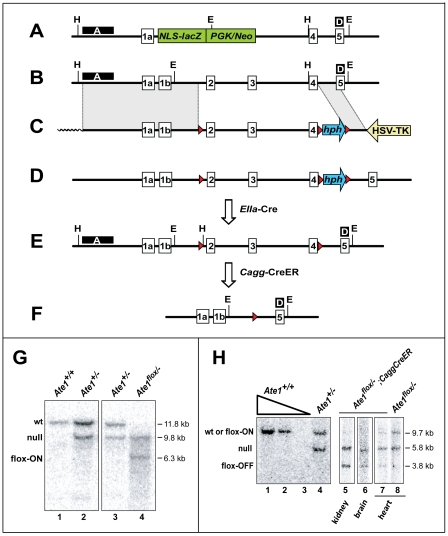
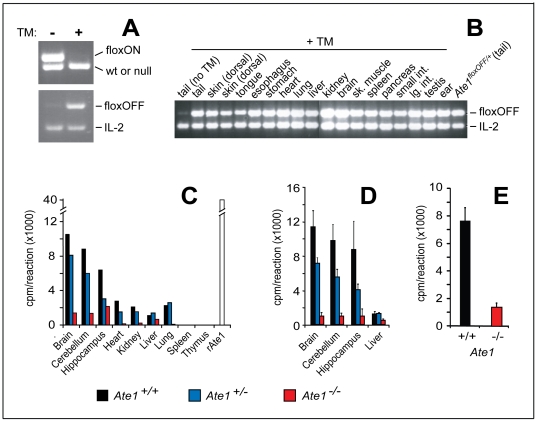
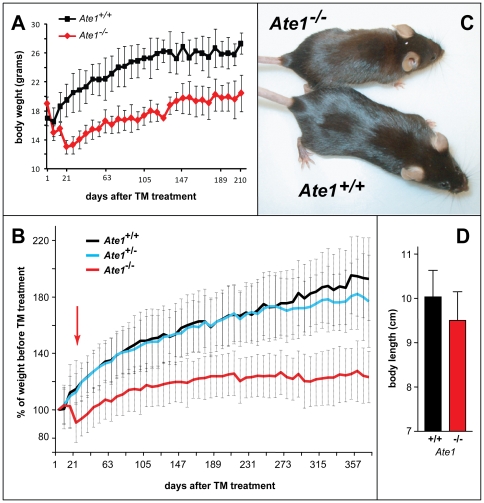
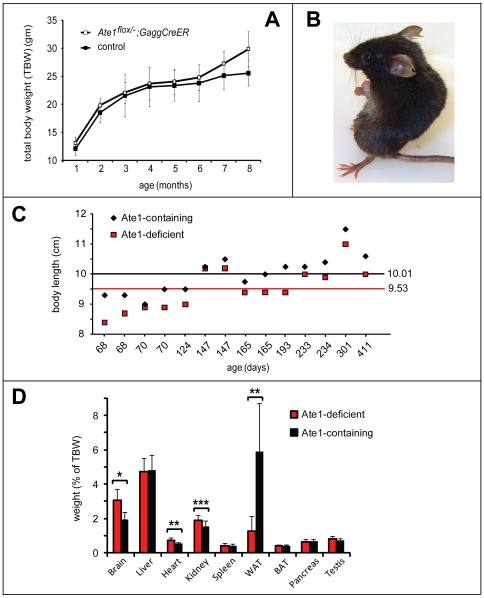
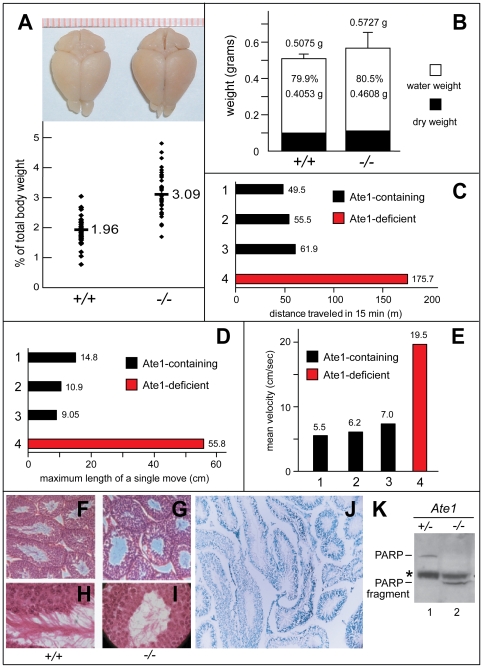
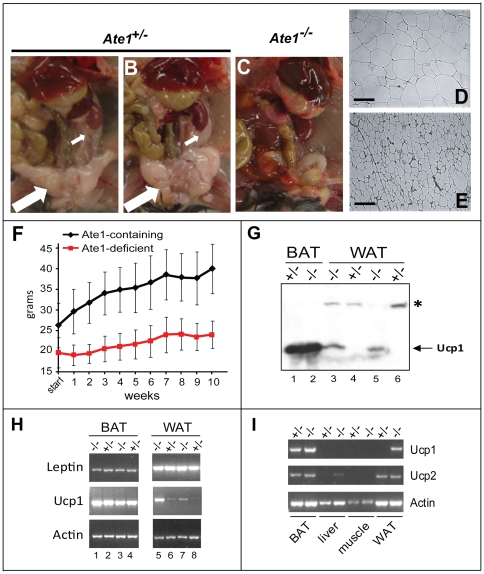
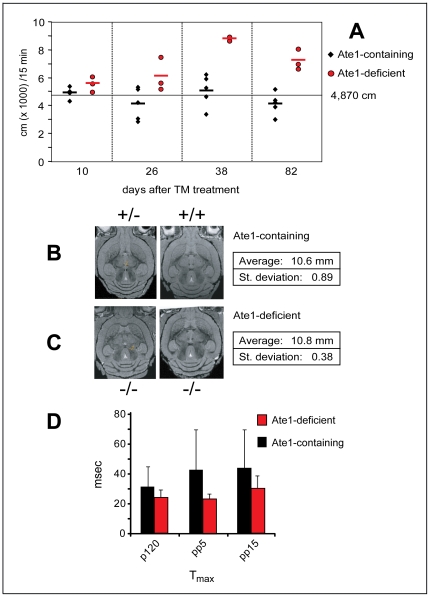
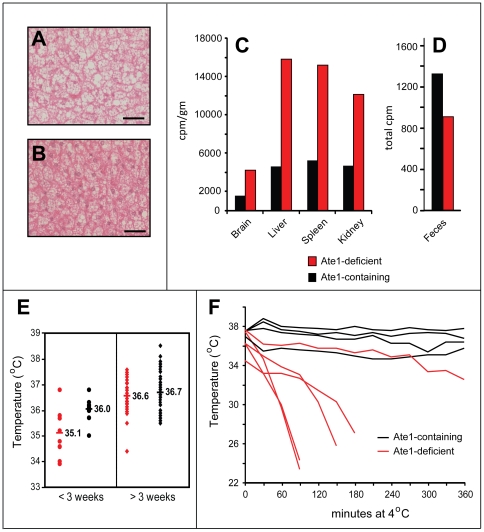
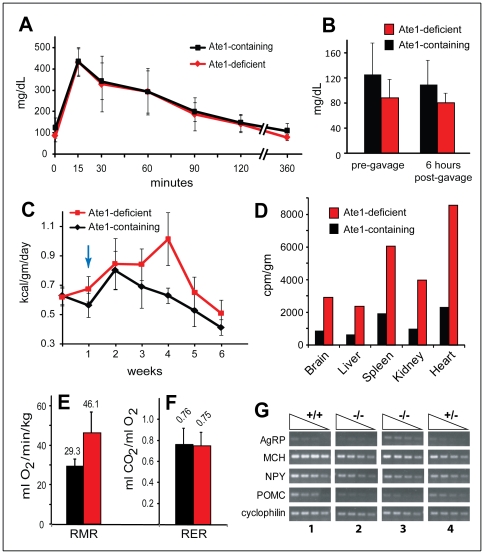
In the N-end rule pathway of protein degradation, the destabilizing activity of N-terminal Asp, Glu or (oxidized) Cys residues requires their conjugation to Arg, which is recognized directly by pathway's ubiquitin ligases. N-terminal arginylation is mediated by the Ate1 arginyltransferase, whose physiological substrates include the Rgs4, Rgs5 and Rgs16 regulators of G proteins. Here, we employed the Cre-lox technique to uncover new physiological functions of N-terminal arginylation in adult mice. We show that postnatal deletion of mouse Ate1 (its unconditional deletion is embryonic lethal) causes a rapid decrease of body weight and results in early death of approximately 15% of Ate1-deficient mice. Despite being hyperphagic, the surviving Ate1-deficient mice contain little visceral fat. They also exhibit an increased metabolic rate, ectopic induction of the Ucp1 uncoupling protein in white fat, and are resistant to diet-induced obesity. In addition, Ate1-deficient mice have enlarged brains, an enhanced startle response, are strikingly hyperkinetic, and are prone to seizures and kyphosis. Ate1-deficient males are also infertile, owing to defects in Ate1(-/-) spermatocytes. The remarkably broad range of specific biological processes that are shown here to be perturbed by the loss of N-terminal arginylation will make possible the dissection of regulatory circuits that involve Ate1 and either its known substrates, such as Rgs4, Rgs5 and Rgs16, or those currently unknown.


Conflict of interest statement

Competing Interests: The authors have declared that no competing interests exist.

Figures

Figure 1
Figure 1. Postnatal ablation of the mouse Ate1 R-transferase, a component of the N-end rule pathway.
(A) The mammalian N-end rule pathway. N-terminal residues are indicated by single-letter abbreviations for amino acids. Yellow ovals denote the rest of a protein substrate. “Primary”, “secondary” and “tertiary” denote mechanistically distinct subsets of destabilizing N-terminal residues (see Introduction). C* denotes oxidized Cys, either Cys-sulfinate or Cys-sulfonate. MetAPs, Met-aminopeptidases. (B) Bidirectional promoter between the mouse Ate1 exons 1A and 1B . Green arrows indicate transcriptional units, including a previously uncharacterized gene, termed Dfa (“divergent of Ate1), that is transcribed from the bidirectional promoter. (C) Immunoblotting-based comparisons of Ate1 levels in the indicated mouse tissues from Ate1+/+ and Ate1flox/−;CaggCreER mice 76 days after the tamoxifen (TM)-induced, Cre-mediated Ate1floxAte1 conversion that yielded Ate1-deficient mice. The band of 60-kDa Ate1, detected by antibody to mouse Ate1, is indicated on the right. Total (Ponceau-stained) protein patterns are shown below, with positions of molecular-mass markers on the left. (D) IB assays for the levels of Ate1 and Rgs4 (25 kDa) in brain extracts from Ate1+/+ and Ate1-deficient mice (Ate1flox/−;CaggCreER mice 30 days after TM treatment).
Figure 2
Figure 2. Genomic configurations at the Ate1 locus of Cre-lox-based mouse strains constructed in the present work.
(A) The 5′ end of the previously produced unconditional Ate1 allele , in which the Ate1 exons 1b through 3 were replaced by a cassette encoding a promoter-lacking, NLS-containing LacZ (NLS-βgal) (it was expressed from the endogenous PAte1 promoter) and the Neo selection marker expressed from the phosphoglycerate kinase PPGK promoter (green rectangles). (B) A diagram of the 5′ end of wild-type (wt) mouse Ate1, indicating approximate locations of exons 1a through 5. (C) The ∼22.5 kb targeting construct containing a ∼6 kb long-arm region of Ate1 homology (shown as a shaded rectangle on the left); a single loxP site (red triangle) upstream of Ate1 exon 2, a “floxed”-hygromycin-resistance (hph) cassette, expressed from the PPGK promoter (blue arrow between two red triangles) downstream of Ate1 exon 4; a ∼2 kb short-arm region of homology (an inclined shaded rectangle), and the HSV thymidine kinase (tk) negative-selection cassette expressed from the PHSV promoter (yellow arrow). Wavy line indicates an abutting sequence of the pBR322 plasmid DNA. (D) The tri-lox Ate1 allele obtained after a correctly targeted double crossover event. (E) In the notations here and elsewhere in the paper, “flox-on” indicates a configuration depicted in this panel (the functionally active Ate1flox allele), whereas “flox-off” indicates a configuration depicted in panel F (the null Ate1 allele). The functionally active, “flox-on” (Ate1flox) allele, obtained by the removal of the hph cassette, using the in vivo expression of Cre-recombinase driven by the PEIIA promoter, which is active only in pre-implantation blastocysts. (F) The null “flox-off” (Ate1) allele obtained by the inducible expression of CreER recombinase from the PCagg promoter and posttranslationally induced by tamoxifen (TM) treatment (see the main text and Materials and Methods). H, approximate locations of HindIII sites used in Southern analyses with DNA probe A (see panel G); E, approximate locations of EcoRI sites used in Southern analyses with DNA probe D (see panel H); black boxes marked “A” and “D” indicate the regions specific for DNA probes A and D, respectively. (G) Southern hybridization analysis using DNA probe A and HindIII-digested genomic DNA. The wt Ate1 allele (panel B) yields the 11.8 kb HindIII fragment. The previously constructed unconditionally null Ate1 allele (panel A), denoted as “null” on this panel, yields the 9.8 kb HindIII fragment. The functionally active flox-on (Ate1flox) allele (panel E) yields the 6.3 kb HindIII fragment. Lane 1, Ate1+/+; lane 2, Ate1+/−; lane 3, Ate1+/−; lane 4, Ate1flox/−. (H) Southern hybridization analysis using DNA probe D (external to targeting vector) and EcoRI-digested genomic DNA. The previously constructed unconditionally null Ate1 allele (denoted as “null”) yields the 5.8 kb fragment. Both the wild-type Ate1 allele and the flox-on (Ate1flox) allele yield the 9.7 kB fragment, whereas the null flox-off (Ate1) allele yields the characteristic 3.8 kb fragment. The use of DNA probe D and EcoRI-digested DNA from specific tissues of tamoxifen (TM)-treated Ate1flox/−;CaggCreER mice allowed approximate estimates of the levels of Cre-mediated recombination that produced the flox-off (Ate1) allele. For example, whereas no flox-on (Ate1flox) allele could be detected in the kidney and brain of Ate1flox/−;CaggCreER mice after TM treatment (lanes 5, 6), approximately equal amounts of flox-on (Ate1flox) and flox-off (Ate1) alleles were present in the heart of TM-treated Ate1flox/−; CaggCreER mice. Lanes 1–3, 1,000, 250, and 25 ng of EcoRI-digested wt mouse genomic DNA (from a tail biopsy), respectively. Lane 4, EcoRI-digested genomic DNA from the tail of a previously constructed Ate1+/− mouse. Lanes 5–7, EcoRI-digested genomic DNA from the indicated tissues of TM-treated Ate1flox/−;CaggCreER mice. Lane 8, same as lane 7, but from a TM-treated Ate1flox/− mouse (lacking the CaggCreER transgene).
Figure 3
Figure 3. Cre-mediated conversion to Ate1-null genotype in different mouse tissues.
(A) PCR-based genotyping of tail DNA to detect the Cre-mediated Ate1floxAte1 conversion of the functionally active flox-on (Ate1flox) allele to the null Ate1 allele in a 27-day old Ate1flox/−;CaggCreER mouse immediately after the fourth (daily) intraperitoneal (IP) injection of tamoxifen (TM+), or in the absence of TM treatment (TM-). Upper panel: the 512 bp DNA fragment characteristic of the flox-on (Ate1flox) allele and the 472 bp DNA fragment characteristic of either wild-type or the previously constructed unconditionally null Ate1 allele, using primers CB156 and CB157 (Table 4). Lower panel: the 470 bp DNA fragment characteristic of the Cre-produced flox-off (Ate1) allele, with primers CB110 and CB157 (Table 4); and the 324 bp DNA fragment (control), amplified from the IL-2 gene using primers IMR42 and IMR43, in the same PCR reaction. (B) The Cre-mediated Ate1floxAte1 conversion, detected by PCR (as described in panel A) in genomic DNA isolated from the indicated tissues immediately after the fourth (daily) IP injection of tamoxifen in a 24-day old Ate1flox/−;CaggCreER mouse. (C) Relative in vitro arginylation activity (cpm/reaction) in extracts of the indicated tissues from a wild type mouse (Ate1+/+) (black bar), a heterozygous mouse (Ate1+/−) (blue bar), and an Ate1−/− mouse (the latter mouse was initially Ate1flox/−;CaggCreER) (red bar) from the same litter 76 days after TM treatment. A white bar on the right indicates the relative arginylation activity obtained with purified recombinant mouse Ate1 (denoted as “rAte1”) that had been expressed in S. cerevisiae. Shown here are “cpm/reaction” after subtracting “cpm/reaction” in the null-control (“buffer alone”) sample. The control incorporation was approximately equal to that observed in extracts from spleen and thymus. In other words, the assay configured as described in this panel and in Materials and Methods was not sensitive enough to robustly detect the arginylation activity in extracts from spleen and thymus. (D) Relative in vitro arginylation activity (cpm/reaction) in the whole brain, cerebellum, and hippocampus harvested from wild type mice (Ate1+/+; n = 3), heterozygous mice (Ate1+/−; n = 3), and Ate1−/− mice (specifically, Ate1flox/−;CaggCreER mice; n = 3) mice 40 days after TM treatment. Standard deviations are indicated. (E) Relative in vitro arginylation activity (cpm/reaction) in testis extracts from Ate1+/+ mice (n = 3) and Ate1−/− mice (specifically, Ate1flox/−;CaggCreER mice; n = 3) ∼130 days after TM treatment. Standard deviations are indicated.
Figure 4
Figure 4. Growth rate consequences of postnatal ablation of Ate1.
(A) Weights of Ate1-containing (n = 4; black curve) and Ate1-deficient (n = 2; red curve) mice from the same litter as a function of time after tamoxifen (TM) treatment. Weights were measured at weekly intervals. Vertical bars indicate the ranges of measured weights. (B) Averaged growth curves for the indicated numbers of mice after TM treatment, plotted as a percentage of their weight immediately before TM treatment. Red, black and blue curves: Ate1−/− (n = 87), Ate1+/+ (n = 55), and Ate1+/− (n = 66) mice. Red arrow indicates the time (∼21 days) after TM treatment by which ∼15% of Ate1-deficient mice have died while the rest of them began to gain weight. Note a slightly but clearly decreased weight of heterozygous (Ate1+/−) mice (blue curve), in comparison to Ate1+/+ mice (black curve) ∼1 year after TM treatment. Error bars indicate standard deviations (SD). (C) Typical appearance of Ate1−/− versus wt mice (a smaller, leaner Ate1−/− mouse) ∼1 year after TM-mediated ablation of Ate1. (D) Mean body lengths (± SD) (from tip-of-nose to base-of-tail) between pairs of Ate1−/− (red bar) and Ate1+/+ (black bar) mice. This comparison was derived from the data in Fig. 5C. Statistical analysis was performed using an unpaired t-test (p<0.08).
Figure 5
Figure 5. Comparison of organ sizes and other parameters of Ate1−/− versus Ate1+/+ mice.
(A) Averaged growth curves (total body weight (TBW)) for Ate1flox/−;CaggCreER mice versus control mice in the absence of TM treatments. A cohort of “control” mice contained Ate1flox/+ mice (n = 2); Ate1flox/− mice (n = 2); Ate1+/+ mice (n = 1) and Ate1+/+;CaggCreER mice (n = 1) from 1 month of age through 8 months. None of the mice were treated with TM. Vertical bars indicate standard deviations. (B) Typical “kyphoid” posture of an Ate1-deficient mouse (see also the main text). (C) A plot of body lengths (in cm from tip-of-nose to base-of tail) in individual sets of Ate1-containing (black diamonds) and Ate1-deficient (red boxes) siblings at the indicated ages. Each pair of symbols, at a given age, represents a single pair of siblings. The black horizontal line indicates the averaged body length of all Ate1-containing mice (n = 14). The red horizontal line indicates the averaged body length of all Ate1-deficient mice (n = 14). (D) Comparison of tissue weights (as a percentage of total body weight (TBW)). Numbers in parentheses indicate the numbers of mice sampled and averaged for each tissue (Ate1-containing and Ate1-deficient). Brain (n = 43), liver (n = 28), heart (n = 17), kidney (n = 17), spleen (n = 16), white adipose tissue (WAT; n = 10), brown adipose tissue (BAT; n = 10), pancreas (n = 6), and testis (n = 8) from Ate1-containing (black bars) and Ate1-deficient mice (red bars). *  =  p<8×10⁻¹⁵; **  =  p<5×10⁻⁵; and ***  =  p<0.003. Statistical analysis was performed using an unpaired t-test. Standard deviations are indicated.
Figure 6
Figure 6. Brain, behavioral, and testis abnormalities of Ate1-deficient mice.
(A) Enlarged brains of Ate1-deficient mice. Upper panel: comparison of representative brains harvested from an Ate1+/+ and an Ate1−/− mouse, respectively, 134 days after tamoxifen (TM) treatment. Lower panel: brain weights expressed as percentages of total body weights in Ate1+/+ (n = 41) and Ate1−/− (n = 40) mice. Horizontal bars and numbers indicate mean values. (B) Wet (0.4053 g versus 0.4608 g) and dry (0.1022 g versus 0.1119 g) weight components of the total mean brain weights (±SD) in Ate1+/+ and Ate1−/− mice. (C) Total distance traveled (in meters), over 15 min, in an open field test among mice of different genotypes belonging to the same litter, 44 days after TM-treatment. Bar 1, Ate1flox/+;CaggCreER mouse. Bar 2, Ate1+/+;CaggCreER mouse. Bar 3, Ate1+/+ mouse. Bar 4, Ate1flox/−;CaggCreER mouse that was converted to Ate1−/− by TM treatment. Blue and red bars denote Ate1-containing and Ate1-deficient mice, respectively. (D) Same as in C but maximum lengths of single movements (in centimeters). (E) Same as in C but mean velocities (in cm/second) over 15 min. (F) Paraffin sections (4 µm) of testis showing cross-sections of seminiferous tubules in Ate1+/+ testis stained with hematoxylin and eosin (150× magnification). (G) Same as in F but Ate1−/− testis. Note that sperm tails in the lumens of Ate1−/− tubules are sparse in comparison to those in Ate1+/+ testis. (H) Same as in F but at 600× magnification. (I) Same as in G but at 600× magnification. (J) XGal staining for βgal activity in a 10-µm section of Ate1+/− testis in which one copy of Ate1 was replaced by an ORF encoding NLS-β-galactosidase and expressed from the PAte1 promoter (100× magnification). (K) Immunoblotting analysis, using antibody to poly (ADP-ribose) polymerase (PARP), of testis extracts from an Ate1-containing (Ate1flox/− (+/−)) and an Ate1-deficient (Ate1flox/−;CaggCreER (−/−)) mouse 16 days after TM treatment. Note the loss of the full-length length 116 kDa PARP and the presence of the 85 kDa PARP fragment (lane2). An asterisk denotes a protein crossreacting with anti-PARP antibody.
Figure 7
Figure 7. Loss of white adipose tissue (WAT), resistance to high fat diet-induced obesity, and ectopic Ucp1 in WAT of Ate1-deficient mice.
(A–C) Visceral fat content of Ate1-containing mice. Shown here are representative examples of Ate1-containing (Ate1flox/+;CaggCreER) (A) and Ate1flox/− (B)) and Ate1-deficient (Ate1flox/−;CaggCreER (C)) mice 37 days after TM-treatment. Note the loss of both visceral fat (large white arrow in A and B) and fat surrounding the kidney (small white arrows in A and B) in an Ate1-deficient mouse (C). (D) Hematoxylin/eosin staining of a 10-µm section of white adipose tissue (WAT) harvested from an Ate1-containing mouse (TM-treated Ate1flox/+;CaggCreER). The bar denotes 100 µm. (E) Same as in D except that WAT was from an Ate1-deficient mouse (TM-treated Ate1flox/−;CaggCreER). (F) Average weights of TM-treated Ate1-containing (n = 12; black curve) and Ate1-deficient (n = 11; red curve) mice as a function of time after the beginning of ad libitum high-fat diet. Weights were measured at weekly intervals for 10 weeks. Error bars indicate ±SD. (G) Comparisons, by immunoblotting, of Ucp1 protein levels in extracts from brown adipose tissue (BAT) (lanes 1 and 2) and WAT (lanes 3 through 6) from Ate1+/− and Ate1−/− mice 46 days (lanes 1 and 2) or ∼1 year (lanes 3–6) after TM treatment. Specific genotypes were as follows (genotypes after TM treatment are indicated in parentheses here, and also on top of the gel): lane 1, Ate1flox/− (+/−); lane 2, Ate1flox/−;CaggCreER (−/−); lane 3, Ate1flox/−;CaggCreER (−/−); lane 4, Ate1flox/− (+/−); lane 5, Ate1flox/−;CaggCreER (−/−); lane 6, Ate1flox/+;CaggCreER (+/−). Note abnormally high expression of Ucp1 in WAT of Ate1-deficient mice (lanes 3 and 5). An asterisk denotes a protein in WAT that cross-reacts with anti-Ucp1 antibody. (H) RT-PCR analyses of leptin and Ucp1 mRNA levels in BAT (lanes 1–4) and WAT (lanes 5–8) of Ate1-containing (denoted as “+/−”; lanes 2, 4, 6, and 8) and Ate1-deficient (denoted as “−/−”; lanes 1, 3, 5, and 7) mice ∼1 year after TM treatment. Specific genotypes: lanes 1 and 5, Ate1flox/flox;CaggCreER (−/−); lanes 2 and 6, Ate1flox/+;CaggCreER (+/−); lanes 3 and 5, Ate1flox/flox;CaggCreER (−/−); lanes 4 and 8, Ate1flox/− (+/−). (I) RT-PCR analyses of Ucp1 and Ucp2 mRNA levels in BAT, liver, muscle, and WAT of an Ate1flox/+ mouse (denoted as “+/−”) and an Ate1flox/−;CaggCreER mouse (denoted as “−/−”)∼1 year after TM treatment.
Figure 8
Figure 8. Brain abnormalities and behavioral phenotypes of Ate1-deficient mice.
(A) Ate1-deficient mice become hyperactive as a function of time after TM-mediated ablation of Ate1. Total distance (in cm) traveled over 15 min in the open field test box (2500 cm2). This test was repeated every ∼2 weeks after the end of TM treatment. The data for Ate1-containing mice (n = 5; their genotypes were Ate1flox/+, Ate1flox/−, and Ate1flox/+;CaggCreER) and Ate1-deficient mice (n = 3; Ate1flox/−;CaggCreER) are indicated by black diamonds and red circles, respectively. The horizontal bars indicate mean values. The average total distance traveled over 15 min for all Ate1-containing mice (n = 37) was 4,870 cm. (B) Representative magnetic resonance images showing equivalent horizontal planes of Ate1-containing (Ate1flox/+;CaggCreER on the left, Ate1flox/+ on the right) brains ∼3 months after TM treatment. The indicated average width of the skull (measured at the widest point from left to right in the same plane) of four Ate1-containing mice was 10.6 mm (±0.89 mm). (C) Same as in B except with brains from Ate1-deficient (Ate1flox/−;CaggCreER) mice ∼3 months after TM-treatment. The average width of the skull (measured as in B) of four Ate1-deficient mice was 10.8 mm (±0.38 mm). (D) Comparison of the response latency (Tmax; recorded in msec) between Ate1-containing (n = 3; black bars) and Ate1-deficient mice (n = 3; red bars) to a 40-msec pulse of 120 dB (p120; p<0.3), a 40-msec pulse of 120 dB preceded by a pre-pulse of 5 dB (pp5; p<0.09), or a 40-msec pulse of 120 dB preceded by a pre-pulse of 15 dB (pp15; p<0.01). Statistical analysis was performed using an unpaired t-test.
Figure 9
Figure 9. Body temperature, amino acid utilization and other properties of Ate1−/− versus Ate1+/+ mice.
(A) Hematoxylin/eosin staining (200× magnification) of a 10-µm section of brown adipose tissue (BAT) harvested from an Ate1-containing mouse (TM-treated Ate1flox/+;CaggCreER). The bar denotes 100 µm. (B) Same as in A except that BAT was from an Ate1-deficient mouse (TM-treated Ate1flox/−;CaggCreER). (C) Relative efficiencies of the import of 14C-amino acids and/or peptides from gastrointestinal tract in an Ate1-containing mouse (black bars; Ate1flox/+;CaggCreER) versus an Ate1-deficient mouse (red bars; Ate1flox/−;CaggCreER) 26 days after TM treatment. Shown here are representative comparisons of the retention of 14C (in cpm/gm) in the brains, livers, spleens, and kidneys 48 hr after gavage with a single bolus of 14C-labeled proteins (see Materials and Methods). (D) Total 14C (cpm) in the feces produced by mice in C within the first 48 hr after gavage with a bolus of 14C-labeled proteins. (E) Average core body temperatures of Ate1-containing (n = 8; black circles) versus Ate1-deficient (n = 11; red circles) mice during the first 3 weeks after TM treatment, in comparison to average core body temperatures of Ate1-containing (n = 54; black diamonds) versus Ate1-deficient (n = 36; red diamonds) mice beyond the first 3 weeks after TM treatment. (F) Core body temperature of individual Ate1-containing (black curves) and Ate1-deficient (red curves) mice, recorded at 30-min intervals after placing mice in a room at 4°C. Mice were removed from the cold room after 6 hr or when their core body temperature fell below 28°C.
Figure 10
Figure 10. Energy balance and metabolic rate in Ate1-deficient mice.
(A) Glucose tolerance test. Glucose concentration (mg/dL) in whole blood of Ate1-containing mice (n = 15; black curve) and Ate1-deficient mice (n = 11; red curve), at different times after a bolus of glucose by gavage, following a 16-hr fast. Glucose was administered at time zero. Error bars indicate ±SD. (B) Fasting blood glucose levels. Average blood glucose levels (mg/dL) in Ate1-containing mice (n = 15; black bar) and Ate1-deficient mice (n = 11; red bar), with measurements shortly before glucose gavage (after a 16-hr fast) and 6 hr after the gavage in A. Standard deviations are indicated. Statistical analysis was performed using an unpaired t-test (p<0.04). (C) Average daily energy consumption (kcal/gm of body weight) for Ate1-containing mice (n = 5; black curve) and Ate1-deficient mice (n = 3; red curve), with measurements from 1 week prior to tamoxifen (TM) treatment. Vertical arrow indicates the beginning of a 5-day TM treatment. Error bars indicate ±SD. (D) Relative efficiencies of the import of 14C-amino acids and 14C-peptides from gastrointestinal tract in Ate1-containing mice (black bars) versus Ate1-deficient mice (red bars). Shown here are representative comparisons of the retention of 14C (in cpm/gm) in the brains, livers, spleens, kidneys, and hearts of indicated mice 16 days after gavage with a single bolus of 14C-labeled proteins (see Materials and Methods). Mice were gavaged 26 days after TM treatment. (E) Comparison of resting metabolic rate (RMR) (measured in O2 (ml) consumed per kg of body weight per min) for Ate1-containing mice (n = 6; black bar) versus Ate1-deficient mice (n = 6; red bar). Standard deviations are indicated in E and F. Statistical analysis was performed using an unpaired t-test (p<0.008). (F) Comparison of the respiratory exchange ratio (RER), measured as CO2 (in ml) per ml of O2, for Ate1-containing mice (n = 6; black bar) and Ate1-deficient mice (n = 6; red bar) mice. No statistically significant difference in RER was observed. (G) RT-PCR analyses of AgRP, MCH, HPY, and POMC mRNA levels in the hypothalami of TM-treated Ate1-containing mice (Sets 1 and 4) versus Ate1-deficient mice (Sets 2 and 3). Set 1, Ate1flox/flox (+/+); Set 2, Ate1flox/flox;CaggCreER (−/−); Set 3, Ate1flox/flox;CaggCreER (−/−); Set 4, Ate1flox/+;CaggCreER (+/−). In sets 1 and 2, hypothalami were isolated 93 days after TM treatment. In sets 3 and 4 hypothalami were isolated ∼1 year after TM treatment. Sloping triangles indicate decreasing inputs (by 2-fold) of total RNA.

References

    1. Varshavsky A. The N-end rule: functions, mysteries, uses. Proc Natl Acad Sci USA. 1996;93:12142–12149. - PMC - PubMed
    1. Varshavsky A. Discovery of cellular regulation by protein degradation. J Biol Chem. 2008;283:34469–34489. - PMC - PubMed
    1. Mogk A, Schmidt R, Bukau B. The N-end rule pathway of regulated proteolysis: prokaryotic and eukaryotic strategies. Trends Cell Biol. 2007;17:165–172. - PubMed
    1. Tasaki T, Kwon YT. The mammalian N-end rule pathway: new insights into its components and physiological roles. Trends Biochem Sci. 2007;32:520–528. - PubMed
    1. Ravid T, Hochstrasser M. Diversity of degradation signals in the ubiquitin-proteasome system. Nat Rev Mol Cell Biol. 2008;9:679–689. - PMC - PubMed

Publication types

LinkOut - more resources