. 2009 Nov 13;4(11):e7839.
doi: 10.1371/journal.pone.0007839.

Gene regulation and epigenetic remodeling in murine embryonic stem cells by c-Myc

Affiliations

Gene regulation and epigenetic remodeling in murine embryonic stem cells by c-Myc

Chin-Hsing Lin et al. PLoS One. .

Abstract

Background: The Myc oncoprotein, a transcriptional regulator involved in the etiology of many different tumor types, has been demonstrated to play an important role in the functions of embryonic stem (ES) cells. Nonetheless, it is still unclear as to whether Myc has unique target and functions in ES cells.

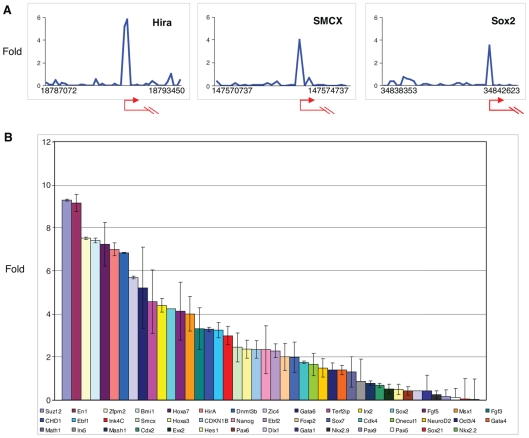
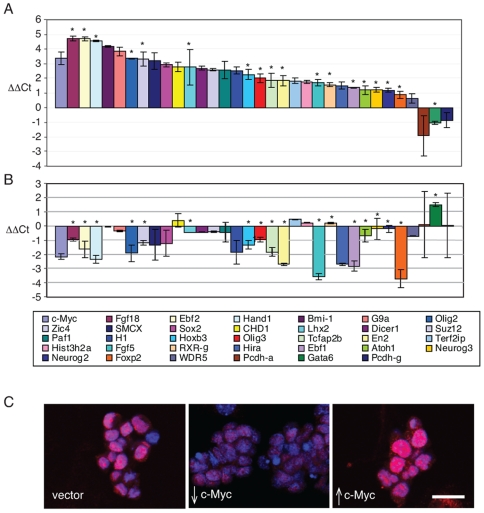
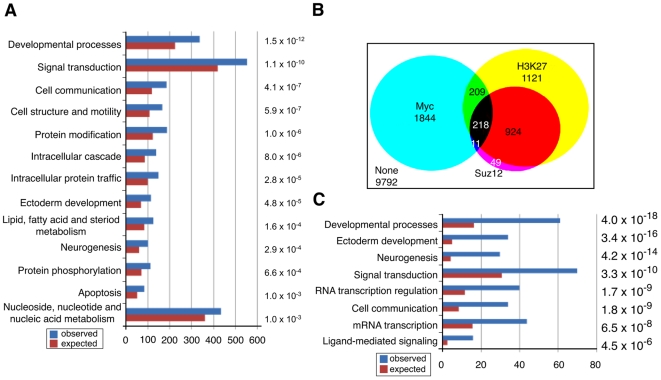
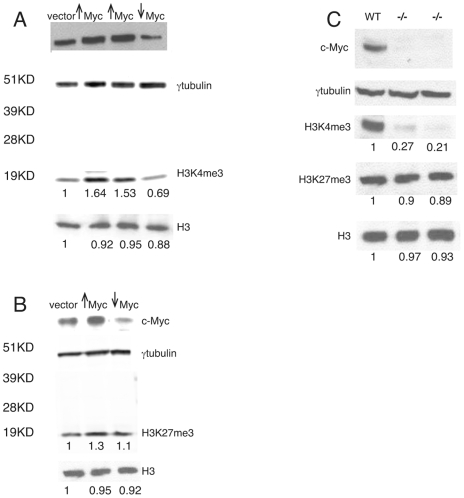
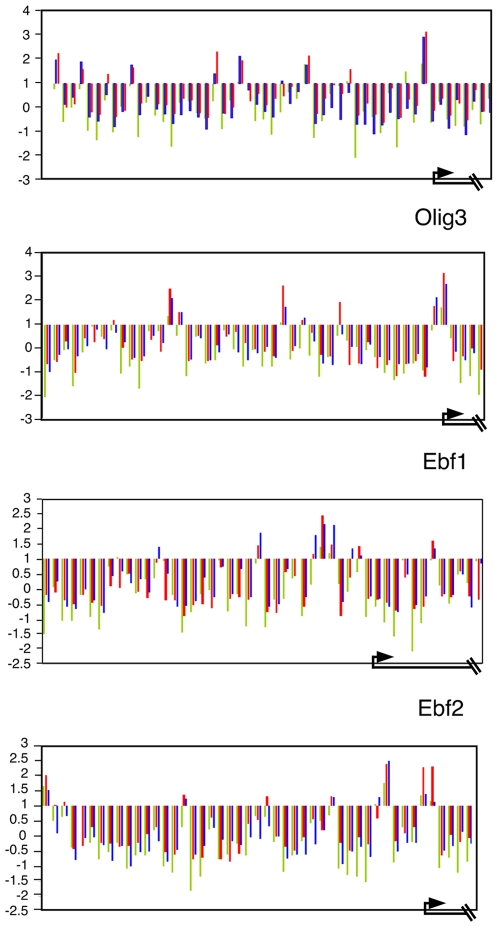
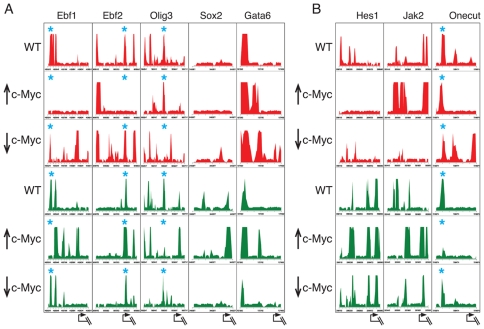
Methodology/principal findings: To elucidate the role of c-Myc in murine ES cells, we mapped its genomic binding sites by chromatin-immunoprecipitation combined with DNA microarrays (ChIP-chip). In addition to previously identified targets we identified genes involved in pluripotency, early development, and chromatin modification/structure that are bound and regulated by c-Myc in murine ES cells. Myc also binds and regulates loci previously identified as Polycomb (PcG) targets, including genes that contain bivalent chromatin domains. To determine whether c-Myc influences the epigenetic state of Myc-bound genes, we assessed the patterns of trimethylation of histone H3-K4 and H3-K27 in mES cells containing normal, increased, and reduced levels of c-Myc. Our analysis reveals widespread and surprisingly diverse changes in repressive and activating histone methylation marks both proximal and distal to Myc binding sites. Furthermore, analysis of bulk chromatin from phenotypically normal c-myc null E7 embryos demonstrates a 70-80% decrease in H3-K4me3, with little change in H3-K27me3, compared to wild-type embryos indicating that Myc is required to maintain normal levels of histone methylation.

Conclusions/significance: We show that Myc induces widespread and diverse changes in histone methylation in ES cells. We postulate that these changes are indirect effects of Myc mediated by its regulation of target genes involved in chromatin remodeling. We further show that a subset of PcG-bound genes with bivalent histone methylation patterns are bound and regulated in response to altered c-Myc levels. Our data indicate that in mES cells c-Myc binds, regulates, and influences the histone modification patterns of genes involved in chromatin remodeling, pluripotency, and differentiation.


Conflict of interest statement

Competing Interests: The authors have declared that no competing interests exist.

Figures

Figure 1
Figure 1. c-Myc-bound promoters in mouse embryonic stem cells identified by ChIP-chip analysis and validated by qChIP-PCR.
(A) Examples of three gene promoter regions identified using chromatin immunoprecipitation with anti-c-Myc antibody to probe DNA microarrays (see Methods and Materials for details). Shown are the fold enrichment ratios for anti-Myc ChIP-enriched versus total input genomic DNA (y axis) for all probes within the genomic regions indicated. Numbers represent the beginning and the end probe positions (x axis). The transcriptional start sites and direction of transcription are noted by arrows. (B) Validation by qChIP-PCR of putative c-Myc target genes in AK7 mES cells. Forty-four genes were selected at random for validation and included c-Myc target and non-c-Myc target genes as determined from the initial promoter array. Equal amounts of anti-c-Myc ChIP DNA and total input DNA were used for quantitative PCR employing SYBR Green detection with an ABI7900HT system. Bar heights represent the average fold enrichment ratios from 2 independent sets of anti-Myc ChIP-enriched versus total input genomic DNA. qChIP-PCR data derived for R1 mES cells is shown in Supplementary Figure S2).
Figure 2
Figure 2. Transcriptional response of c-Myc target genes to c-Myc overexpression or knockdown.
(A) Response of a subset of c-Myc target genes to Lentiviral mediated overexpression c-Myc in mES cells as determined by Real-Time PCR. Each bar represents the average (ΔΔCt) from triplicate sets of experiments on a log2 scale after normalization to internal controls and vector alone. The fold differences detected range from ∼2–20 fold. Note an approximately eight-fold increase in c-myc RNA levels (bar at far left). Color-coded genes are read from left to right (inset). (B) Response of a subset of c-Myc target genes to RNAi mediated knock-down of c-Myc in mES cells as determined by Real-Time PCR. Each bar represents the average (ΔΔCt) from a triplicate set of experiments on a log2 scale after normalization to internal controls and vector alone. c-myc RNA levels decreased 4 fold (bar at far left). Color-coded genes are read from left to right (inset). * indicates previously identified bivalent gene. (C) Sox2 immunostaining in mES cells. mES cells were infected with empty lentiviral vector alone (WT; left panel); lentiviral vector expressing shRNA against c-myc (middle panel); lentiviral vector expressing c-myc (right panel). Scale bar indicates 50 µm See Supplementary Figure S4 for immunoblots of Sox2 protein.
Figure 3
Figure 3. c-Myc, and Polycomb proteins share target genes.
(A) Gene Ontology categories of c-Myc associated genes in murine ES cells. Functional categories derived for genes enriched at least 4-fold for c-Myc binding and possessing an ACME p<0.0001 in the ChIP-chip assay (see Materials and Methods and Supplementary Table S1). The numbers to the right represent the p-values for the statistical over-representation in each category. (B) Venn diagram depicting the overlap among murine ES cell genes bound by c-Myc (this paper), Suz12, and those displaying trimethylation of H3-K27 . Nearly 96% of promoters bound by Suz12 also show the H3-K27me3 mark. Of genes associated with Myc (2282) 17% are associated with the H3-K27me3 mark and 9.5% associated with both Suz12 and H3-K27me3 (for gene list see Supplementary Table S3). (C) Gene ontology categories of gene displaying overlap among c-Myc, Suz12 binding and H3-K27me3 marks. Functional categories were derived for genes enriched at least 4-fold for c-Myc binding in the ChIP-chip assay (see Methods and Supplementary Table S1). Suz12 and H3-K27me3 bound genes were previously described . Numbers to the right are p-values for the statistical over-representation among genes within a functional category.
Figure 4
Figure 4. Quantitation of H3K4me3 and H3K27me3 levels in response to c-Myc.
(A) Response of H3K4me3 to Lentiviral mediated overexpression or knock-down c-Myc in mES cells as determined by western blot. (B) Response of H3K27me3 to Lentiviral mediated overexpression or knock-down c-Myc in mES cells as determined by western blot. (C) Effect of H3K4me3 and H3K27me3 level in response to c-Myc loss in early developmental embryos. Ratios based on normalization to γ-tubulin internal control wwere calculated using ImageJ software .
Figure 5
Figure 5. c-Myc binding sites on a subset of gene promoters in mES cells.
c-Myc levels were manipulated by Lentiviral-delivered overexpression or knock-down of c-Myc in mES cells followed by anti-Myc ChIP-chip analysis on custom- designed arrays (see text). Unprocessed enrichment ratios (log2 scale) present ChIP-enriched versus total input genomic DNA (crosslinked, sonicated and processed identically to the ChIP sample) (y axis) for all probes within a genomic region 2 kb upstream and 1 kb downstream of the TSS. The TSS and direction of transcription are denoted by arrows at the bottom of the figure. Blue bars: endogenous c-Myc binding in WT mES cells, Red bars: Myc overexpressing mES cells, Green bars: Myc knock-down mES cells. Negative values occur when there is no enrichment in ChIP DNA relative to input.
Figure 6
Figure 6. c-Myc levels influence the pattern of histone H3 lysine methylation in mES cells.
(A) a group of genes bound by c-Myc (B) a group of non-Myc target genes. c-Myc levels were manipulated by (1) Lentiviral-delivered overexpression (↑c-Myc) (2) knock-down (↓ c-Myc), or (3) empty lentiviral vector control in ES cells. ChIP DNA isolated with anti-H3K4me3 or anti-H3-K27me3 was applied to the custom-designed arrays (see text). Enrichment ratios (log2 scale) for ChIP-enriched versus total input genomic DNA were processed by ACME and the given p values (−log10; y axis) identifying significant sites were plotted (see Methods). Red peaks present H3-K27me3 and green peaks present H3K4me3. Tick marks on the y-axis are spaced 400 bp apart. Asterisks mark positions of overlapping (bivalent) H3-K4me3 and H3-K27me3 peaks. The arrows at bottom indicate transcriptional start sites.

References

    1. Meshorer E, Yellajoshula D, George E, Scambler PJ, Brown DT, et al. Hyperdynamic plasticity of chromatin proteins in pluripotent embryonic stem cells. Dev Cell. 2006;10:105–116. - PMC - PubMed
    1. Meshorer E, Misteli T. Chromatin in pluripotent embryonic stem cells and differentiation. Nat Rev Mol Cell Biol. 2006;7:540–546. - PubMed
    1. Niwa H. Open conformation chromatin and pluripotency. Genes Dev. 2007;21:2671–2676. - PubMed
    1. Silva J, Smith A. Capturing pluripotency. Cell. 2008;132:532–536. - PMC - PubMed
    1. Efroni S, Duttagupta R, Cheng J, Dehghani H, Hoeppner DJ, et al. Global transcription in pluripotent embryonic stem cells. Cell Stem Cell. 2008;2:437–447. - PMC - PubMed

Publication types