

The p38/MAPK pathway regulates microtubule polymerization through phosphorylation of MAP4 and Op18 in hypoxic cells
- PMID: 19915797
- PMCID: PMC11115776
- DOI: 10.1007/s00018-009-0187-z
The p38/MAPK pathway regulates microtubule polymerization through phosphorylation of MAP4 and Op18 in hypoxic cells
Abstract
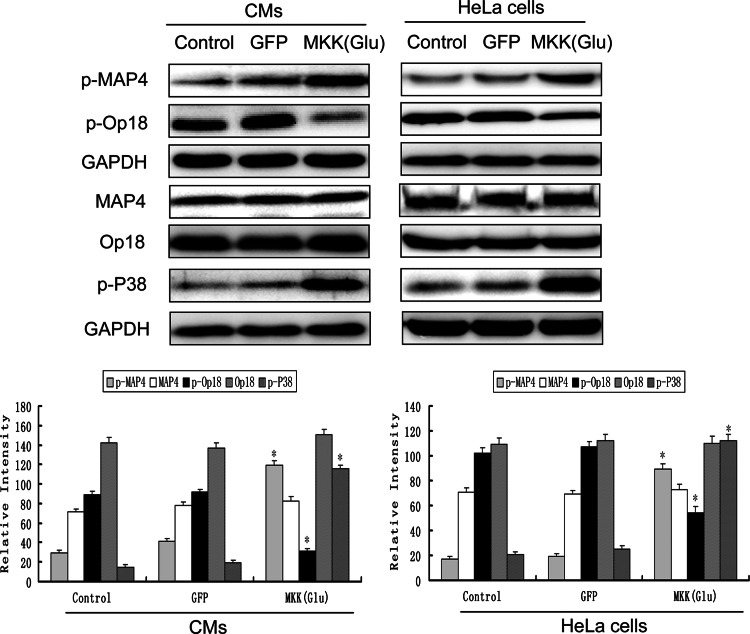
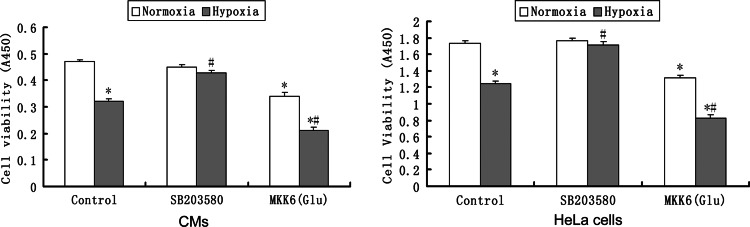
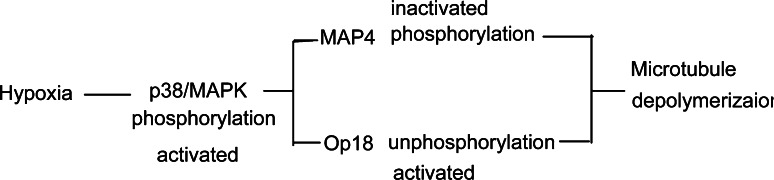
In both cardiomyocytes and HeLa cells, hypoxia (1% O(2)) quickly leads to microtubule disruption, but little is known about how microtubule dynamics change during the early stages of hypoxia. We demonstrate that microtubule associated protein 4 (MAP4) phosphorylation increases while oncoprotein 18/stathmin (Op18) phosphorylation decreases after hypoxia, but their protein levels do not change. p38/MAPK activity increases quickly after hypoxia concomitant with MAP4 phosphorylation, and the activated p38/MAPK signaling leads to MAP4 phosphorylation and to Op18 dephosphorylation, both of which induce microtubule disruption. We confirmed the interaction between phospho-p38 and MAP4 using immunoprecipitation and found that SB203580, a p38/MAPK inhibitor, increases and MKK6(Glu) overexpression decreases hypoxic cell viability. Our results demonstrate that hypoxia induces microtubule depolymerization and decreased cell viability via the activation of the p38/MAPK signaling pathway and changes the phosphorylation levels of its downstream effectors, MAP4 and Op18.
Figures


Similar articles
-
Hypoxia impairs autophagy of cardiomyocytes via p38/MAPK/MAP4 pathway.Burns. 2025 Jun;51(5):107511. doi: 10.1016/j.burns.2025.107511. Epub 2025 Apr 18. Burns. 2025. PMID: 40318591
-
Microtubular stability affects pVHL-mediated regulation of HIF-1alpha via the p38/MAPK pathway in hypoxic cardiomyocytes.PLoS One. 2012;7(4):e35017. doi: 10.1371/journal.pone.0035017. Epub 2012 Apr 10. PLoS One. 2012. PMID: 22506063 Free PMC article.
-
The p38/mitogen-activated protein kinase pathway is implicated in lipopolysaccharide-induced microtubule depolymerization via up-regulation of microtubule-associated protein 4 phosphorylation in human vascular endothelium.Surgery. 2015 Mar;157(3):590-8. doi: 10.1016/j.surg.2014.10.007. Epub 2014 Nov 3. Surgery. 2015. PMID: 25633728
-
Predominant regulators of tubulin monomer-polymer partitioning and their implication for cell polarization.Cell Mol Life Sci. 2009 Oct;66(20):3263-76. doi: 10.1007/s00018-009-0084-5. Epub 2009 Jul 8. Cell Mol Life Sci. 2009. PMID: 19585080 Free PMC article. Review.
-
Spindle assembly and the art of regulating microtubule dynamics by MAPs and Stathmin/Op18.Trends Cell Biol. 2000 Jul;10(7):261-7. doi: 10.1016/s0962-8924(00)01786-4. Trends Cell Biol. 2000. PMID: 10856928 Review.
Cited by
-
Advanced Glycation End Products Impair Glucose-Stimulated Insulin Secretion of a Pancreatic β-Cell Line INS-1-3 by Disturbance of Microtubule Cytoskeleton via p38/MAPK Activation.J Diabetes Res. 2016;2016:9073037. doi: 10.1155/2016/9073037. Epub 2016 Aug 22. J Diabetes Res. 2016. PMID: 27635403 Free PMC article.
-
P38/MAPK contributes to endothelial barrier dysfunction via MAP4 phosphorylation-dependent microtubule disassembly in inflammation-induced acute lung injury.Sci Rep. 2015 Mar 9;5:8895. doi: 10.1038/srep08895. Sci Rep. 2015. PMID: 25746230 Free PMC article.
-
The emerging role of microtubules in invasion plasticity.Front Oncol. 2023 Feb 13;13:1118171. doi: 10.3389/fonc.2023.1118171. eCollection 2023. Front Oncol. 2023. PMID: 36860323 Free PMC article. Review.
-
Microtubule associated protein 4 phosphorylation leads to pathological cardiac remodeling in mice.EBioMedicine. 2018 Nov;37:221-235. doi: 10.1016/j.ebiom.2018.10.017. Epub 2018 Oct 13. EBioMedicine. 2018. PMID: 30327268 Free PMC article.
-
Effect of the Rho-Kinase/ROCK Signaling Pathway on Cytoskeleton Components.Genes (Basel). 2023 Jan 20;14(2):272. doi: 10.3390/genes14020272. Genes (Basel). 2023. PMID: 36833199 Free PMC article. Review.
References
-
- Gomez AM, Kerfant BG, Vassort G. Microtubule disruption modulates Ca2+ signaling in rat cardiac myocytes. Circ Res. 2000;86:30–36. - PubMed
-
- Webster DR, Patrick DL. Beating rate of isolated neonatal cardiomyocytes is regulated by stable microtubule subset. Am J Physiol Heart Circ. 2000;278:H1653–1661. - PubMed
Publication types
MeSH terms
Substances
LinkOut - more resources
Full Text Sources
Research Materials
Miscellaneous
