. 2009 Nov 15;3(3):101-12.
doi: 10.1007/s12154-009-0033-7.

Towards native-state imaging in biological context in the electron microscope

Affiliations

Towards native-state imaging in biological context in the electron microscope

Anne E Weston et al. J Chem Biol. .

Abstract

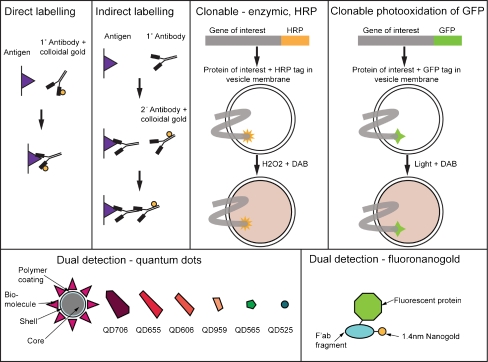
Modern cell biology is reliant on light and fluorescence microscopy for analysis of cells, tissues and protein localisation. However, these powerful techniques are ultimately limited in resolution by the wavelength of light. Electron microscopes offer much greater resolution due to the shorter effective wavelength of electrons, allowing direct imaging of sub-cellular architecture. The harsh environment of the electron microscope chamber and the properties of the electron beam have led to complex chemical and mechanical preparation techniques, which distance biological samples from their native state and complicate data interpretation. Here we describe recent advances in sample preparation and instrumentation, which push the boundaries of high-resolution imaging. Cryopreparation, cryoelectron microscopy and environmental scanning electron microscopy strive to image samples in near native state. Advances in correlative microscopy and markers enable high-resolution localisation of proteins. Innovation in microscope design has pushed the boundaries of resolution to atomic scale, whilst automatic acquisition of high-resolution electron microscopy data through large volumes is finally able to place ultrastructure in biological context.


Figures

Fig. 1
Fig. 1
Schematic overview of transmission and scanning electron microscopes. a Samples must be cut into ultrathin sections in order for the electron beam to transmit and form an image on the detector in the TEM (Micrograph - stacked membranes of the Golgi apparatus). b In the SEM, the electron beam is scanned over the surface of the sample to produce topographical or compositional information from the surface layer only (Micrograph - Drosophila melanogaster compound eye). D detector
Fig. 2
Fig. 2
Flow diagram of sample preparation techniques for electron microscopy. Traditional chemical fixation, staining and resin embedding procedures protect biological samples against the harsh environment of the EM chamber but induce processing artifacts. Developments in cryopreservation and cryo-EM minimise processing and preserve samples closer to their native state. Environmental SEMs take high-resolution imaging a step closer to native state using hydrated samples at ambient temperature
Fig. 3
Fig. 3
Comparison of different sample preparation techniques for electron microscopy. a TEM image of a routinely processed HUVEC showing WPBs (arrows) forming at the trans-Golgi network (TGN), compared with b TEM image of a high-pressure frozen and freeze substituted HUVEC showing improved preservation of volatile elements including coats and protein tubules in forming WPBs (arrow). c TEM image of desmosomes (arrows) in routinely processed tissue culture cells compared with d TEM image of desmosomes (arrows) prepared by CEMOVIS showing improved resolution and near native state preservation. e Immunogold localisation of secretogranin in dense granules in PC12 cells, imaged by TEM. f Immunogold labelling of the plasma membrane of an immune cell (asterisk) demonstrating membrane transfer across the immune synapse, imaged by backscattered electron imaging in the SEM. Bars = 200 nm except f = 1 μm. a, b Adapted with permission from [106]. d Image courtesy of Dr. Ashraf Al-Amoudi, EMBL
Fig. 4
Fig. 4
Comparison of zero-loss imaging and electron energy loss spectroscopy. a In zero-loss imaging mode, the selecting aperture allows only transmitted electrons to reach the detector. This increases contrast and improves resolution for thick sections due to the elimination of scattered electrons. b In EELS, the selecting aperture is moved, and the accelerating voltage of the TEM is increased to select for electrons that were slowed down by their interactions with a specific element
Fig. 5
Fig. 5
Examples of strategies for localisation of proteins in cells and tissues for EM. Direct and indirect immunolabelling uses antibodies specific for the protein of interest, conjugated to an electron dense marker (usually colloidal gold) for pre-embedding labelling of permeabilised cells, post-embedding labelling onto hydrophilic resins and immunolabelling of cryosections. Clonable markers, including HRP and green fluorescent protein (GFP), can be converted to electron dense products that can be detected in the EM. CLEM is most efficient when used with markers, which can be detected in both the light and electron microscope including quantum dots and fluoronanogold. Quantum dots are illustrated to show approximate shape in EM as well as colour in the fluorescence microscope
Fig. 6
Fig. 6
Comparison of traditional TEM and SEM with volume EM. a–d Tumour cells invading in response to stromal fibroblasts in a collagen I/matrigel matrix (samples courtesy of Dr. Erik Sahai, Cancer Research UK London Research Institute). a TEM image of cells gives high-resolution information but represents only an ultrathin section through a large sample. N cell nucleus, Ma matrix. b SEM image of a freeze fracture plane through the sample, which gives 3D information from the surface but lacks high-resolution information through the volume. c Serial images from a dataset of 219 images, automatically collected by focused ion beam/scanning electron microscopy (FIB/SEM). The contrast has been inverted to resemble traditional TEM images. d 3D reconstruction (Amira software, Visage Imaging Inc.) of the full FIB/SEM dataset showing x, y and z orthoslices, giving high-resolution information through the volume of the sample to aid analysis of cell–cell contacts (data acquisition in collaboration with Dr. Andreas Schertel, Carl Zeiss NTS Gmbh). Bar (a, b) 2 μm, (d) 1 μm

Similar articles

Cited by

References

    1. Adrian M, Dubochet J, Lepault J, McDowall AW. Cryo-electron microscopy of viruses. Nature. 1984;308:32–36. - PubMed
    1. Adrian M, Dubochet J, Fuller SD, Harris JR. Cryo-negative staining. Micron. 1998;29:145–160. - PubMed
    1. Agronskaia AV, Valentijn JA, van Driel LF, Schneijdenberg CTWM, Humbel BM, van Bergen En Henegouwen PMP, Verkleij AJ, Koster AJ, Gerritsen HC (2008) Integrated fluorescence and transmission electron microscopy. J Struct Biol 164:183–189 - PubMed
    1. Al-Amoudi A, Norlen LP, Dubochet J. Cryo-electron microscopy of vitreous sections of native biological cells and tissues. J Struct Biol. 2004;148:131–135. - PubMed
    1. Al-Amoudi A, Studer D, Dubochet J. Cutting artefacts and cutting process in vitreous sections for cryo-electron microscopy. J Struct Biol. 2005;150:109–121. - PubMed

LinkOut - more resources