

Trees and networks before and after Darwin
- PMID: 19917100
- PMCID: PMC2793248
- DOI: 10.1186/1745-6150-4-43
Trees and networks before and after Darwin
Abstract
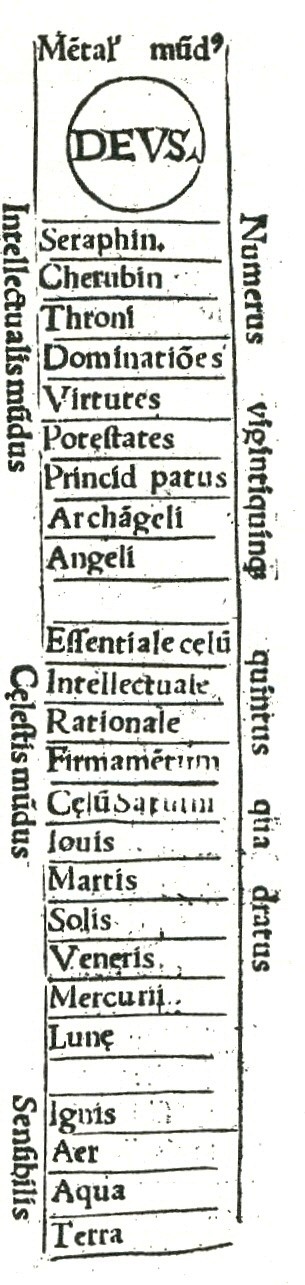
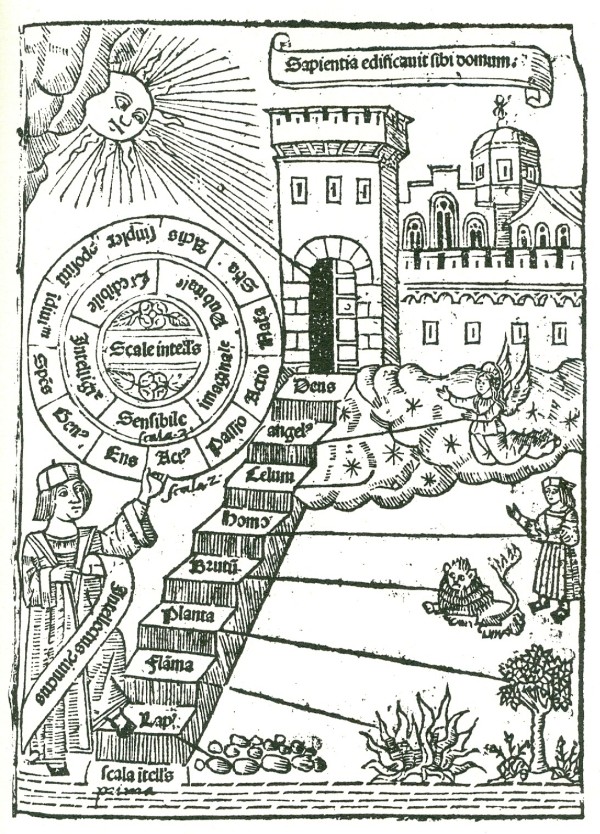
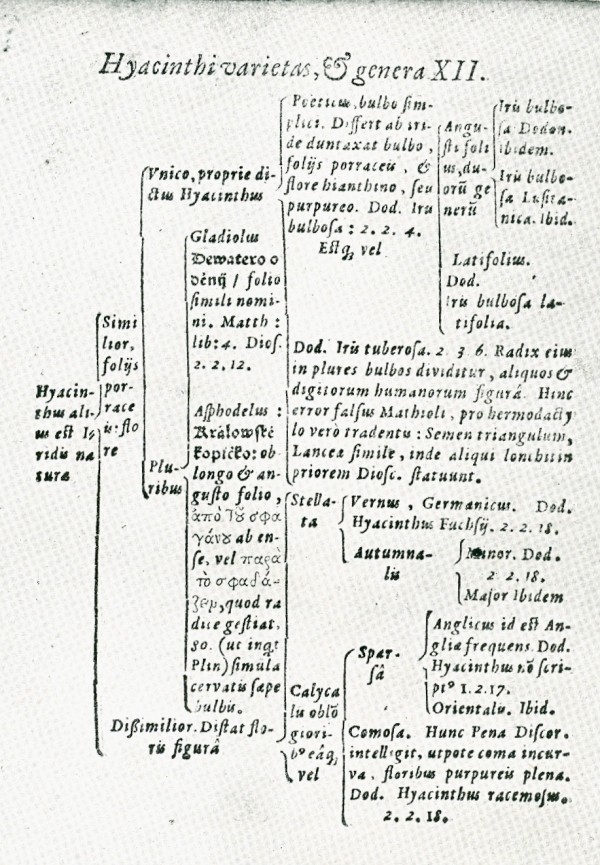
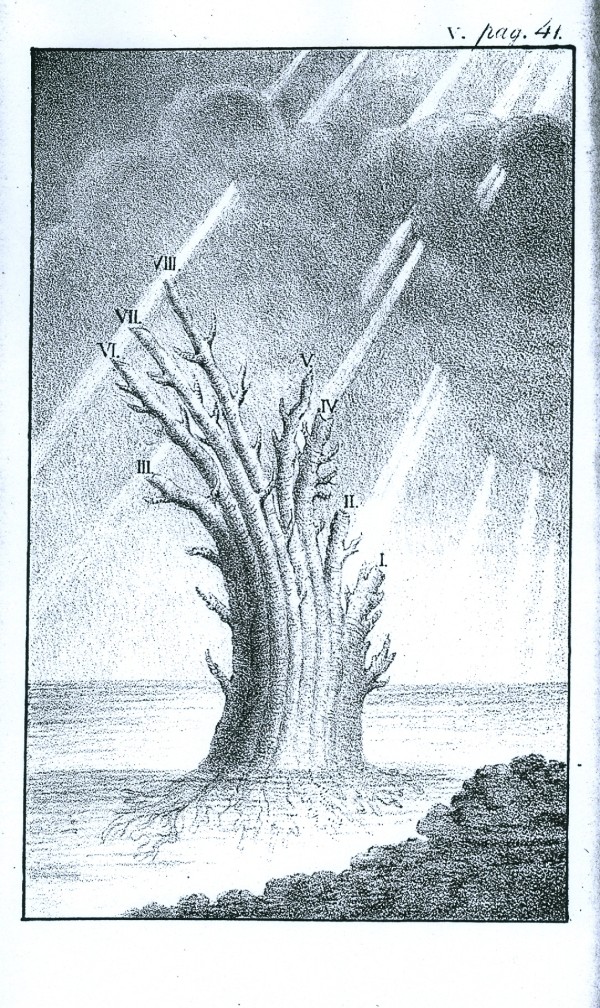
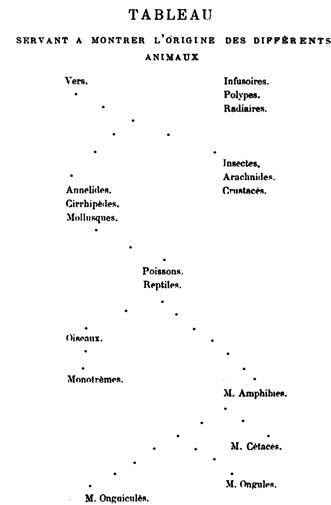
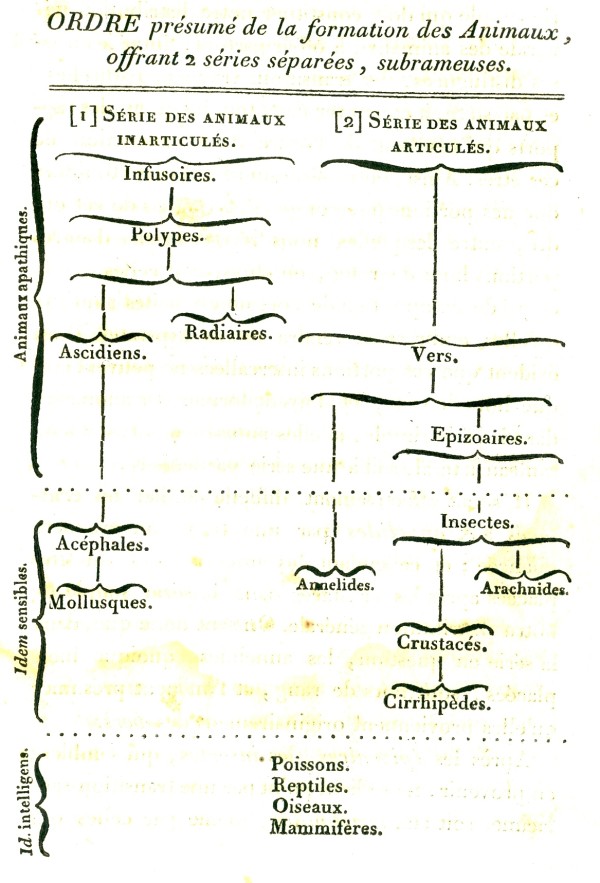
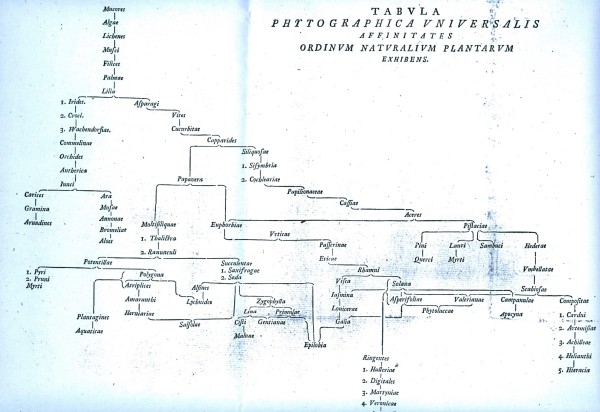
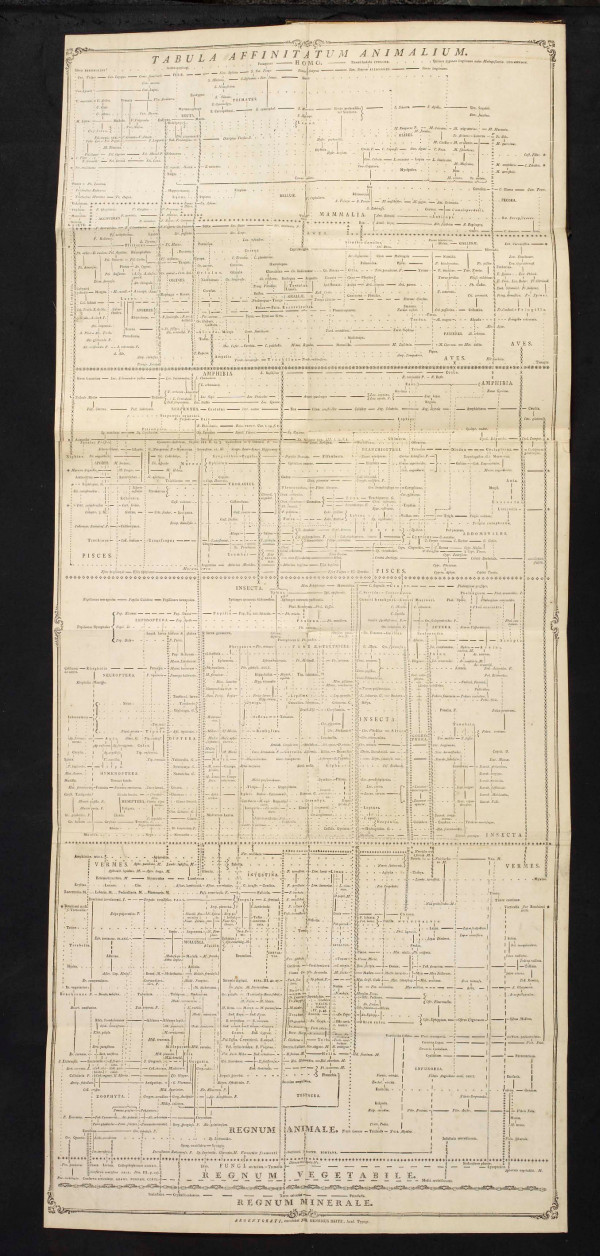
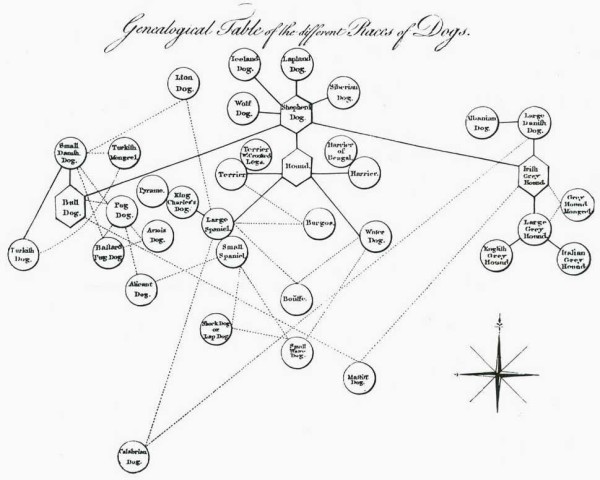
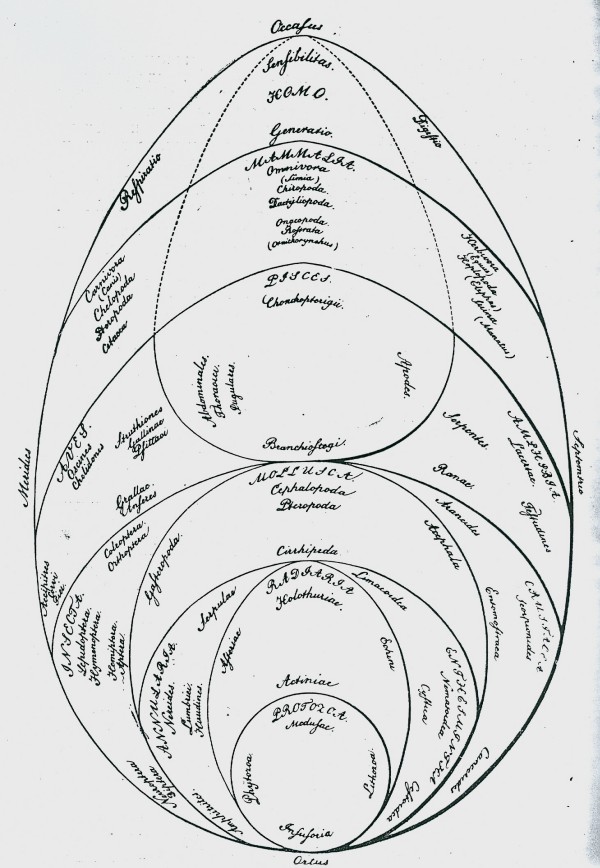
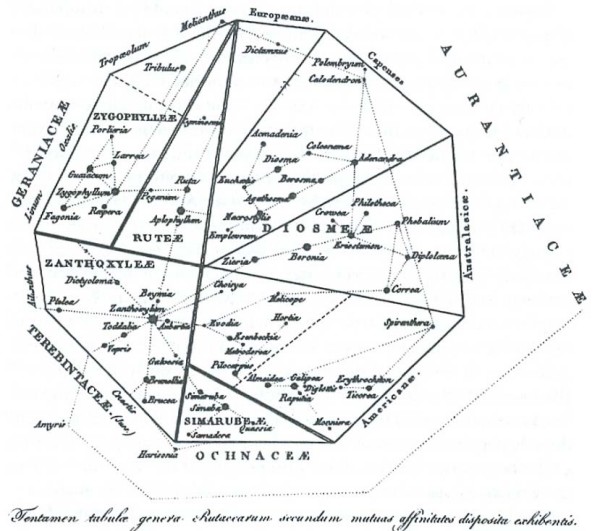
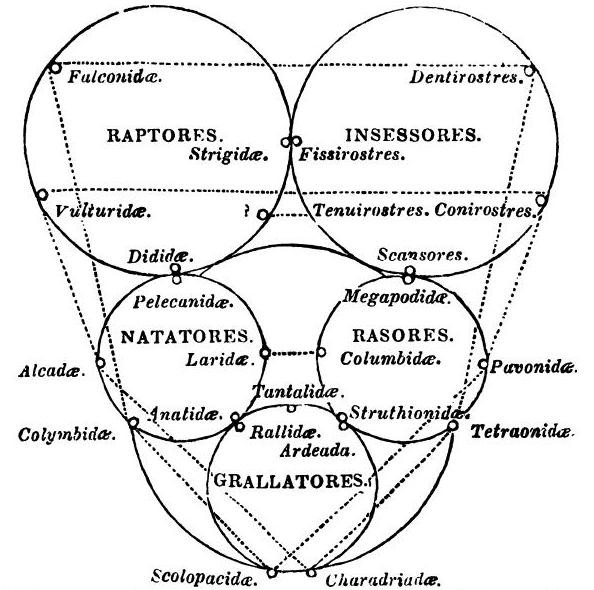
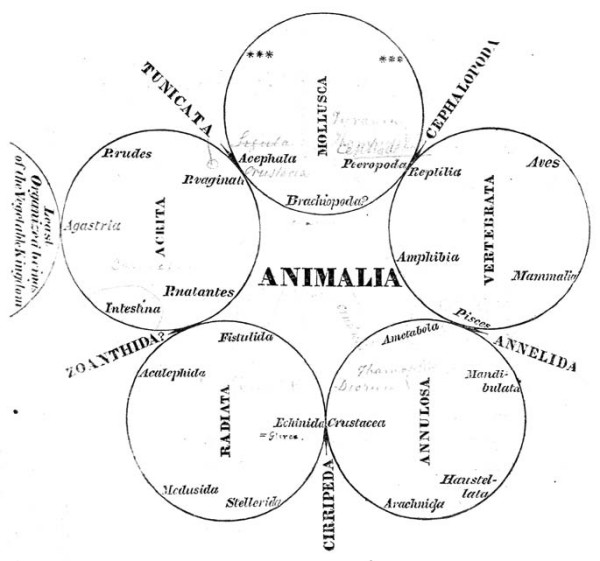
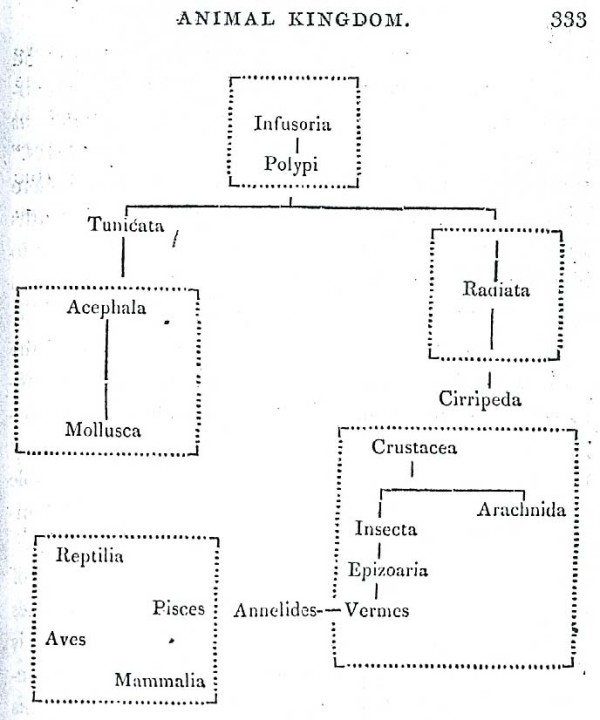
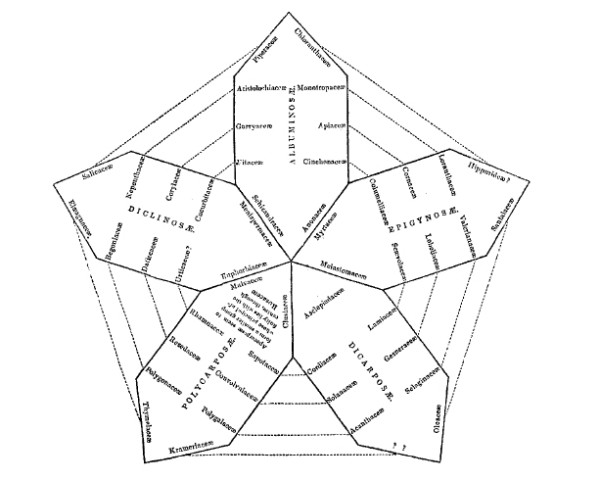
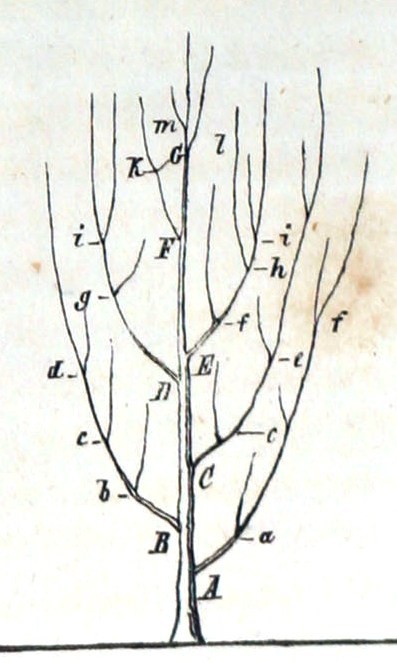
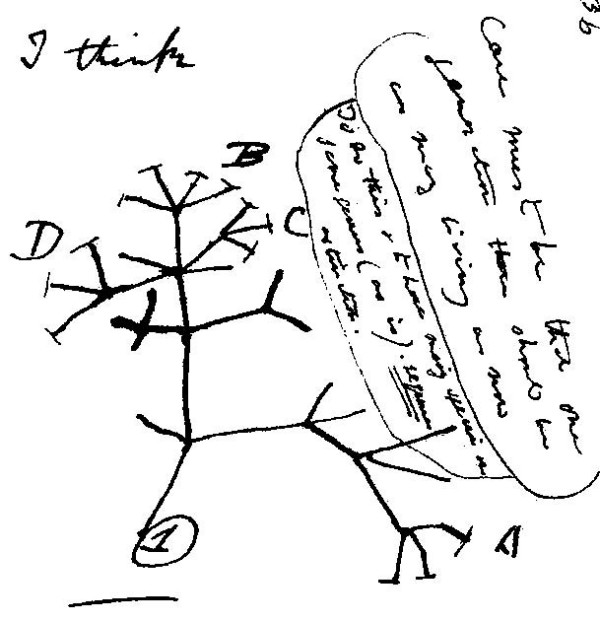
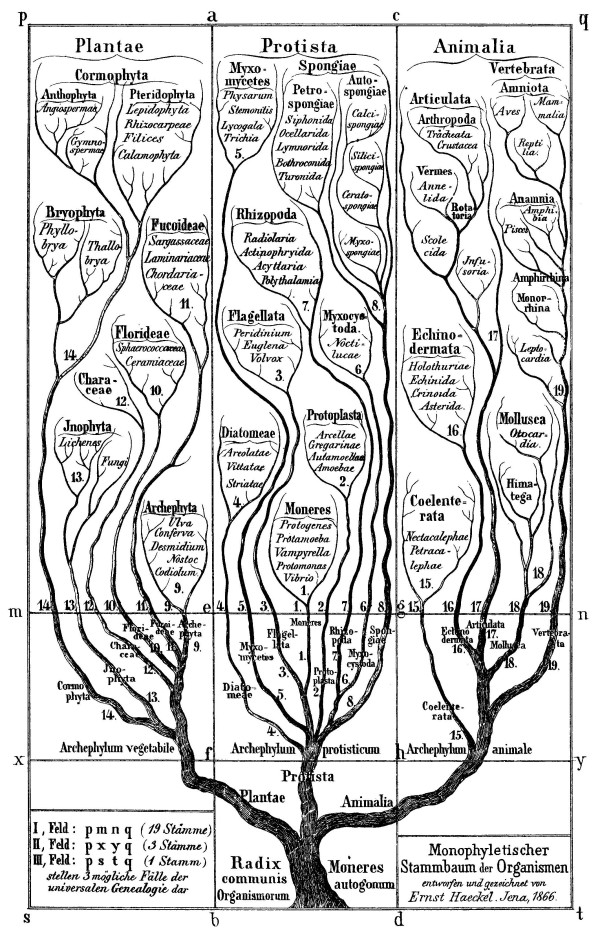
It is well-known that Charles Darwin sketched abstract trees of relationship in his 1837 notebook, and depicted a tree in the Origin of Species (1859). Here I attempt to place Darwin's trees in historical context. By the mid-Eighteenth century the Great Chain of Being was increasingly seen to be an inadequate description of order in nature, and by about 1780 it had been largely abandoned without a satisfactory alternative having been agreed upon. In 1750 Donati described aquatic and terrestrial organisms as forming a network, and a few years later Buffon depicted a network of genealogical relationships among breeds of dogs. In 1764 Bonnet asked whether the Chain might actually branch at certain points, and in 1766 Pallas proposed that the gradations among organisms resemble a tree with a compound trunk, perhaps not unlike the tree of animal life later depicted by Eichwald. Other trees were presented by Augier in 1801 and by Lamarck in 1809 and 1815, the latter two assuming a transmutation of species over time. Elaborate networks of affinities among plants and among animals were depicted in the late Eighteenth and very early Nineteenth centuries. In the two decades immediately prior to 1837, so-called affinities and/or analogies among organisms were represented by diverse geometric figures. Series of plant and animal fossils in successive geological strata were represented as trees in a popular textbook from 1840, while in 1858 Bronn presented a system of animals, as evidenced by the fossil record, in a form of a tree. Darwin's 1859 tree and its subsequent elaborations by Haeckel came to be accepted in many but not all areas of biological sciences, while network diagrams were used in others. Beginning in the early 1960s trees were inferred from protein and nucleic acid sequences, but networks were re-introduced in the mid-1990s to represent lateral genetic transfer, increasingly regarded as a fundamental mode of evolution at least for bacteria and archaea. In historical context, then, the Network of Life preceded the Tree of Life and might again supersede it.
Figures


Similar articles
-
Edward Hitchcock's pre-Darwinian (1840) "tree of life".J Hist Biol. 2009 Fall;42(3):561-92. doi: 10.1007/s10739-008-9163-y. J Hist Biol. 2009. PMID: 20027787
-
The roots of phylogeny: how did Haeckel build his trees?Syst Biol. 2003 Aug;52(4):515-27. doi: 10.1080/10635150390218277. Syst Biol. 2003. PMID: 12857642
-
Diagramming Evolution: The Case of Darwin's Trees.Endeavour. 2018 Jun-Sep;42(2-3):157-171. doi: 10.1016/j.endeavour.2018.07.003. Epub 2018 Aug 10. Endeavour. 2018. PMID: 30104014
-
Chapter 33: the history of movement disorders.Handb Clin Neurol. 2010;95:501-46. doi: 10.1016/S0072-9752(08)02133-7. Handb Clin Neurol. 2010. PMID: 19892136 Review.
-
Charles Darwin, beetles and phylogenetics.Naturwissenschaften. 2009 Nov;96(11):1293-312. doi: 10.1007/s00114-009-0601-2. Epub 2009 Sep 17. Naturwissenschaften. 2009. PMID: 19760277 Review.
Cited by
-
Hyperbolic geometry of the olfactory space.Sci Adv. 2018 Aug 29;4(8):eaaq1458. doi: 10.1126/sciadv.aaq1458. eCollection 2018 Aug. Sci Adv. 2018. PMID: 30167457 Free PMC article.
-
Genomic architecture of MHC-linked odorant receptor gene repertoires among 16 vertebrate species.Immunogenetics. 2010 Sep;62(9):569-84. doi: 10.1007/s00251-010-0468-6. Epub 2010 Aug 3. Immunogenetics. 2010. PMID: 20680261 Review.
-
The treeness of the tree of historical trees of life.PLoS One. 2020 Jan 15;15(1):e0226567. doi: 10.1371/journal.pone.0226567. eCollection 2020. PLoS One. 2020. PMID: 31940355 Free PMC article.
-
The Public Goods Hypothesis for the evolution of life on Earth.Biol Direct. 2011 Aug 23;6:41. doi: 10.1186/1745-6150-6-41. Biol Direct. 2011. PMID: 21861918 Free PMC article.
-
A Historical Taxonomy of Origin of Species Problems and Its Relevance to the Historiography of Evolutionary Thought.J Hist Biol. 2017 Nov;50(4):927-987. doi: 10.1007/s10739-016-9453-8. J Hist Biol. 2017. PMID: 27822903
References
-
- Nieremberg IE. Historia naturae, maxime peregrinae, libris xvi. Antverpiae: Plantiniana Balthasaris Moreti; p. 1635.
-
- Budge EAW. The Book of the Dead. The Papyrus of Ani in the British Museum. London: The British Museum; 1895. pp. lxx–lxxi.
-
- Kirchweger AJ. Aurea Catena Homeri. Frankfurt and Leipzig: Johann Georg Böhme; p. 1723.
-
- Lovejoy AO. The Great Chain of Being. A Study of the History of an Idea. New York: Harper; 1965. originally published 1936.
-
- Kuntz ML, Kuntz PG, Eds. Jacob's Ladder and the Tree of Life. Concepts of Hierarchy and the Great Chain of Being (revised edition). American University Studies, Series V. Philosophy. Vol. 14. New York: Peter Lang; 1987.
Publication types
MeSH terms
LinkOut - more resources
Full Text Sources
Other Literature Sources
