

B cells and monocytes from patients with active multiple sclerosis exhibit increased surface expression of both HERV-H Env and HERV-W Env, accompanied by increased seroreactivity
- PMID: 19917105
- PMCID: PMC2780989
- DOI: 10.1186/1742-4690-6-104
B cells and monocytes from patients with active multiple sclerosis exhibit increased surface expression of both HERV-H Env and HERV-W Env, accompanied by increased seroreactivity
Abstract
Background: The etiology of the neurogenerative disease multiple sclerosis (MS) is unknown. The leading hypotheses suggest that MS is the result of exposure of genetically susceptible individuals to certain environmental factor(s). Herpesviruses and human endogenous retroviruses (HERVs) represent potentially important factors in MS development. Herpesviruses can activate HERVs, and HERVs are activated in MS patients.
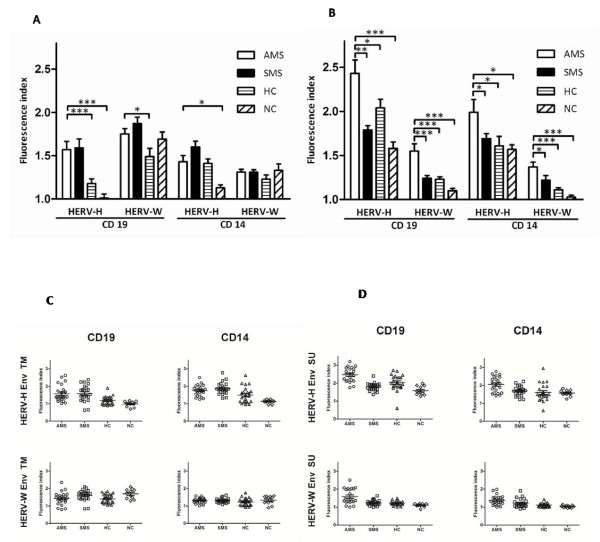
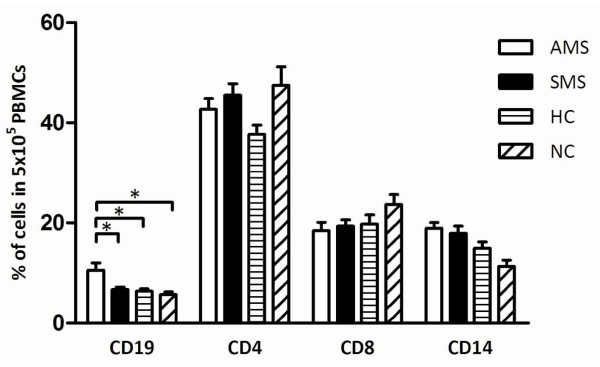
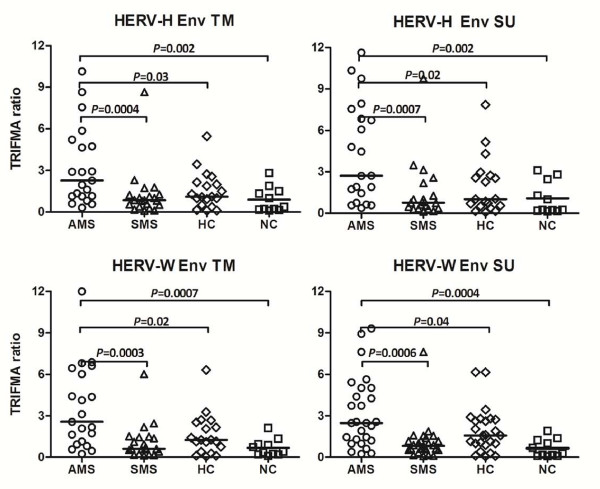
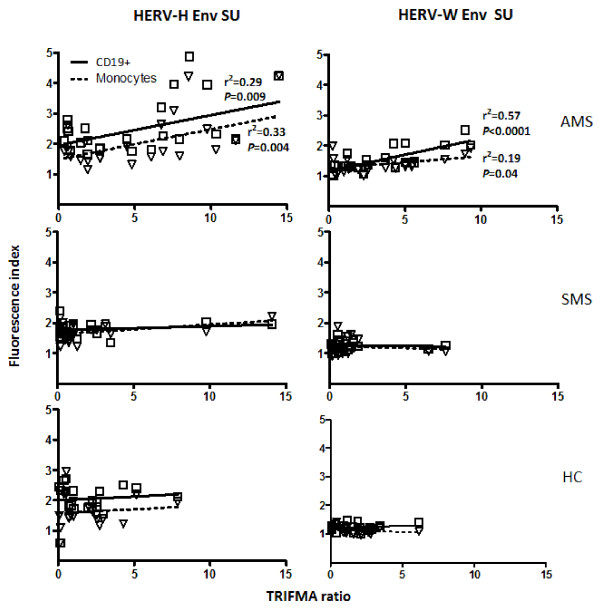
Results: Using flow cytometry, we have analyzed HERV-H Env and HERV-W Env epitope expression on the surface of PBMCs from MS patients with active and stable disease, and from control individuals. We have also analyzed serum antibody levels to the expressed HERV-H and HERV-W Env epitopes. We found a significantly higher expression of HERV-H and HERV-W Env epitopes on B cells and monocytes from patients with active MS compared with patients with stable MS or control individuals. Furthermore, patients with active disease had relatively higher numbers of B cells in the PBMC population, and higher antibody reactivities towards HERV-H Env and HERV-W Env epitopes. The higher antibody reactivities in sera from patients with active MS correlate with the higher levels of HERV-H Env and HERV-W Env expression on B cells and monocytes. We did not find such correlations for stable MS patients or for controls.
Conclusion: These findings indicate that both HERV-H Env and HERV-W Env are expressed in higher quantities on the surface of B cells and monocytes in patients with active MS, and that the expression of these proteins may be associated with exacerbation of the disease.
Figures

Similar articles
-
Do Antiretroviral Drugs Protect From Multiple Sclerosis by Inhibiting Expression of MS-Associated Retrovirus?Front Immunol. 2019 Jan 22;9:3092. doi: 10.3389/fimmu.2018.03092. eCollection 2018. Front Immunol. 2019. PMID: 30740110 Free PMC article. Clinical Trial.
-
Syncytin-1/HERV-W envelope is an early activation marker of leukocytes and is upregulated in multiple sclerosis patients.Eur J Immunol. 2020 May;50(5):685-694. doi: 10.1002/eji.201948423. Epub 2020 Feb 11. Eur J Immunol. 2020. PMID: 32012247
-
Expression and activation by Epstein Barr virus of human endogenous retroviruses-W in blood cells and astrocytes: inference for multiple sclerosis.PLoS One. 2012;7(9):e44991. doi: 10.1371/journal.pone.0044991. Epub 2012 Sep 27. PLoS One. 2012. PMID: 23028727 Free PMC article.
-
Association of human endogenous retroviruses with multiple sclerosis and possible interactions with herpes viruses.Rev Med Virol. 2005 May-Jun;15(3):179-211. doi: 10.1002/rmv.465. Rev Med Virol. 2005. PMID: 15782388 Review.
-
HERVs in neuropathogenesis.J Neuroimmune Pharmacol. 2010 Sep;5(3):326-35. doi: 10.1007/s11481-010-9214-y. Epub 2010 Apr 27. J Neuroimmune Pharmacol. 2010. PMID: 20422298 Review.
Cited by
-
Transcriptional Regulation of Endogenous Retroviruses and Their Misregulation in Human Diseases.Int J Mol Sci. 2022 Sep 4;23(17):10112. doi: 10.3390/ijms231710112. Int J Mol Sci. 2022. PMID: 36077510 Free PMC article. Review.
-
Citrullination of histone H3 interferes with HP1-mediated transcriptional repression.PLoS Genet. 2012 Sep;8(9):e1002934. doi: 10.1371/journal.pgen.1002934. Epub 2012 Sep 13. PLoS Genet. 2012. PMID: 23028349 Free PMC article.
-
Generation, Characterization and Application of Antibodies Directed against HERV-H Gag Protein in Colorectal Samples.PLoS One. 2016 Apr 27;11(4):e0153349. doi: 10.1371/journal.pone.0153349. eCollection 2016. PLoS One. 2016. PMID: 27119520 Free PMC article.
-
The Decrease in Human Endogenous Retrovirus-H Activity Runs in Parallel with Improvement in ADHD Symptoms in Patients Undergoing Methylphenidate Therapy.Int J Mol Sci. 2018 Oct 23;19(11):3286. doi: 10.3390/ijms19113286. Int J Mol Sci. 2018. PMID: 30360480 Free PMC article.
-
Do Antiretroviral Drugs Protect From Multiple Sclerosis by Inhibiting Expression of MS-Associated Retrovirus?Front Immunol. 2019 Jan 22;9:3092. doi: 10.3389/fimmu.2018.03092. eCollection 2018. Front Immunol. 2019. PMID: 30740110 Free PMC article. Clinical Trial.
References
-
- Noseworthy JH. Progress in determining the causes and treatment of multiple sclerosis. Nature. 1999;399:A40–A47. - PubMed
-
- Simmons A. Herpesvirus and multiple sclerosis. Herpes. 2001;8:60–63. - PubMed
-
- Brudek T, Christensen T, Hansen HJ, Bobecka J, Moller-Larsen A. Simultaneous presence of endogenous retrovirus and herpes virus antigens has profound effect on cell-mediated immune responses: implications for multiple sclerosis. AIDS Res Hum Retroviruses. 2004;20:415–423. doi: 10.1089/088922204323048168. - DOI - PubMed
Publication types
MeSH terms
Substances
LinkOut - more resources
Full Text Sources
Other Literature Sources
Medical
