. 2009 Nov 16:10:531.
doi: 10.1186/1471-2164-10-531.

3' tag digital gene expression profiling of human brain and universal reference RNA using Illumina Genome Analyzer

Affiliations

3' tag digital gene expression profiling of human brain and universal reference RNA using Illumina Genome Analyzer

Yan W Asmann et al. BMC Genomics. .

Abstract

Background: Massive parallel sequencing has the potential to replace microarrays as the method for transcriptome profiling. Currently there are two protocols: full-length RNA sequencing (RNA-SEQ) and 3'-tag digital gene expression (DGE). In this preliminary effort, we evaluated the 3' DGE approach using two reference RNA samples from the MicroArray Quality Control Consortium (MAQC).

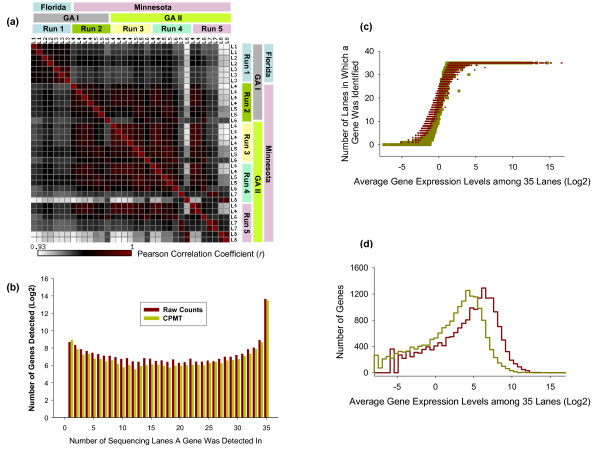
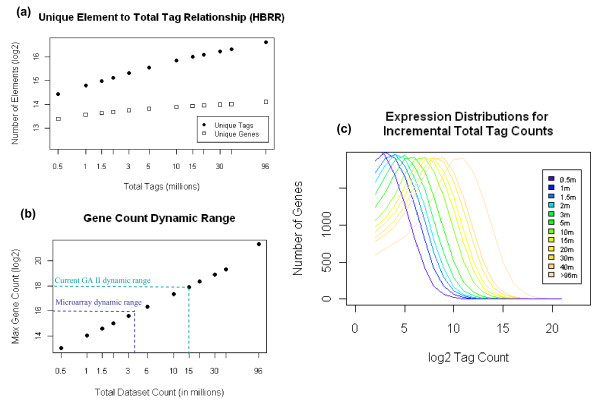
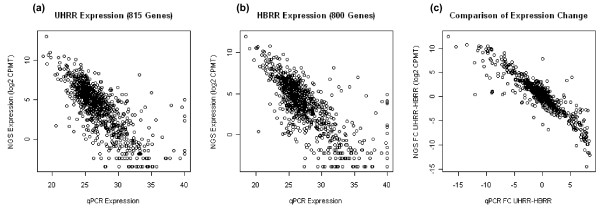
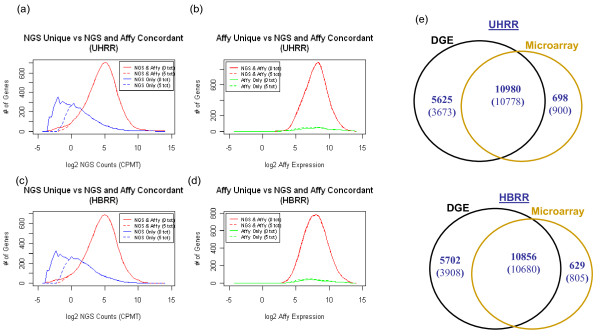
Results: Using Brain RNA sample from multiple runs, we demonstrated that the transcript profiles from 3' DGE were highly reproducible between technical and biological replicates from libraries constructed by the same lab and even by different labs, and between two generations of Illumina's Genome Analyzers. Approximately 65% of all sequence reads mapped to mitochondrial genes, ribosomal RNAs, and canonical transcripts. The expression profiles of brain RNA and universal human reference RNA were compared which demonstrated that DGE was also highly quantitative with excellent correlation of differential expression with quantitative real-time PCR. Furthermore, one lane of 3' DGE sequencing, using the current sequencing chemistry and image processing software, had wider dynamic range for transcriptome profiling and was able to detect lower expressed genes which are normally below the detection threshold of microarrays.

Conclusion: 3' tag DGE profiling with massive parallel sequencing achieved high sensitivity and reproducibility for transcriptome profiling. Although it lacks the ability of detecting alternative splicing events compared to RNA-SEQ, it is much more affordable and clearly out-performed microarrays (Affymetrix) in detecting lower abundant transcripts.


Figures

Figure 1
Figure 1
Reproducibility of 3' tag digital gene expression profiling. 1a - Pearson correlation coefficient matrix of all 8 HBRR libraries prepared at two Mayo locations (Minnesota and Florida), sequenced in 35 lanes of 5 different runs on two generations of Genome Analyzer (I and II). The rows and columns are all 35 lanes in 5 HBRR sequencing runs, and named using the corresponding library names (L1-L8). The same libraries in each run have been grouped together for visual benefits. The correlation coefficient was calculated using Log2 transformed tag counts. The tag counts of zero were coded as missing data. The actual numbers of the correlation coefficient are listed in the Additional File 2. The color in each squire of the matrix reflects the pair-wise lane-to-lane degree of correlation of gene expression levels; 1b - Concordance of gene detection. Gene expression levels are represented by the raw number of reads (dark red) and number of reads per million (yellow). More than 70% of the genes were repeatedly detected in all 35 lanes. 1c - The relationship between gene detection and expression levels. Genes that were detected in less than 35 lanes were lower expressed at levels of 1-2 CPMT, or 0.35-0.7 copies per cell; 1d - The histogram of gene expression levels.
Figure 2
Figure 2
Distribution of tag frequency per DpnII digestion site (ordered 3' to 5') for samples UHRR (2a) and HBRR (2b).
Figure 3
Figure 3
Relationship in HBRR between increasing number of raw sequences analyzed (0.5 to 96 million) and the number of unique 3a -- tags and genes identified, 3b -- the increase in dynamic range of gene expression measurement, and 3c -- the impact on the distribution of gene expression.
Figure 4
Figure 4
Scatter plot of gene expression level measurements using the 3' tag DGE and qPCR technologies, for (4a) UHRR sample, (4b) HBRR sample, and (4c) UHRR vs. HBRR differential expression. The gene expression levels from qPCR are represented by PCR cycle number, and the expression levels from DGE are represented by Log2 of CPMT (counts per million tags)
Figure 5
Figure 5
ENSEMBL gene expression distribution separated by method of detection and sample analyzed: expression distribution in DGE counts for genes identified in (a) UHRR and (c) HBRR, by both DGE and Affymetrix microarray (red line), as well as by DGE alone (blue line); expression distribution in Affymetrix microarray expression values for genes identified in (b) UHRR and (d) HBRR, by both DGE and Affymetrix microarray (red line), as well as by Affymetrix alone (green line). The differential expression between UHRR and HBRR for genes identified by: (e) both DGE and Affymetrix, as well as, NGS alone, in NGS counts; (f) both NGS and Affymetrix, as well as, Affymetrix only, in Affymetrix microarray expression values. (g) Comparison of the number of expressed genes detected by DGE and microarrays. Values for relaxed (at least one read) and stringent (at least five reads) DGE parameters are in bold or in brackets, respectively.

References

    1. Velculescu VE, Zhang L, Vogelstein B, Kinzler KW. Serial analysis of gene expression. Science. 1995;270(5235):484–487. doi: 10.1126/science.270.5235.484. - DOI - PubMed
    1. Schena M, Shalon D, Davis RW, Brown PO. Quantitative monitoring of gene expression patterns with a complementary DNA microarray. Science. 1995;270(5235):467–470. doi: 10.1126/science.270.5235.467. - DOI - PubMed
    1. Lockhart DJ, Dong H, Byrne MC, Follettie MT, Gallo MV, Chee MS, Mittmann M, Wang C, Kobayashi M, Horton H, Brown EL. Expression monitoring by hybridization to high-density oligonucleotide arrays. Nat Biotechnol. 1996;14(13):1675–1680. doi: 10.1038/nbt1296-1675. - DOI - PubMed
    1. Adams MD, Kerlavage AR, Fleischmann RD, Fuldner RA, Bult CJ, Lee NH, Kirkness EF, Weinstock KG, Gocayne JD, White O, Sutton G, Blake JA, Brandon RC, Chiu M, Clayton RA, Cline RT, Cotton MD, Hughes JE, Fine LD, Fitzgerald LM, FitzHugh WM, Fritchman JL, Geoghagen NSM, Glodek A, Gnehm CL, Hanna MC, Hedblom E, Hinkle PS Jr, Kelley JM, Klimek KM, Kelley JC, Liu L, Marmaros SM, Merrick JM, Moreno-Palanques RF, McDonald LA, Nguyen DT, Pellegrino SM, Phillips CA, Ryder SE, Scott JL, Saudek DM, Shirley R, Small KV, Spriggs TA, Utterback TR, Weidman JF, Li Y, Barthlow R, Bednarik DP, Cao L, Cepeda MA, Coleman TA, Collins E, Dimke D, Feng P, Ferrie A, Fischer C, Hastings GA, He W, Hu J, Huddleston KA, Greene JM, Gruber J, Hudson P, Kim A, Kozak DL, Kunsch C, Ji H, Li H, Meissner PS, Olsen H, Raymond L, Wei Y, Wing J, Xu C, Yu G, Ruben SM, Dillon PJ, Fannon MR, Rosen CA, Haseltine WA, Fields C, M FC, Venter JC. Initial assessment of human gene diversity and expression patterns based upon 83 million nucleotides of cDNA sequence. Nature. 1995;377(6547 Suppl):3–174. - PubMed
    1. Boguski MS, Tolstoshev CM, Bassett DE Jr. Gene discovery in dbEST. Science. 1994;265(5181):1993–1994. doi: 10.1126/science.8091218. - DOI - PubMed

Publication types

LinkOut - more resources