

Coexistence of immiscible mixtures of palmitoylsphingomyelin and palmitoylceramide in monolayers and bilayers
- PMID: 19917225
- PMCID: PMC2776254
- DOI: 10.1016/j.bpj.2009.08.040
Coexistence of immiscible mixtures of palmitoylsphingomyelin and palmitoylceramide in monolayers and bilayers
Abstract
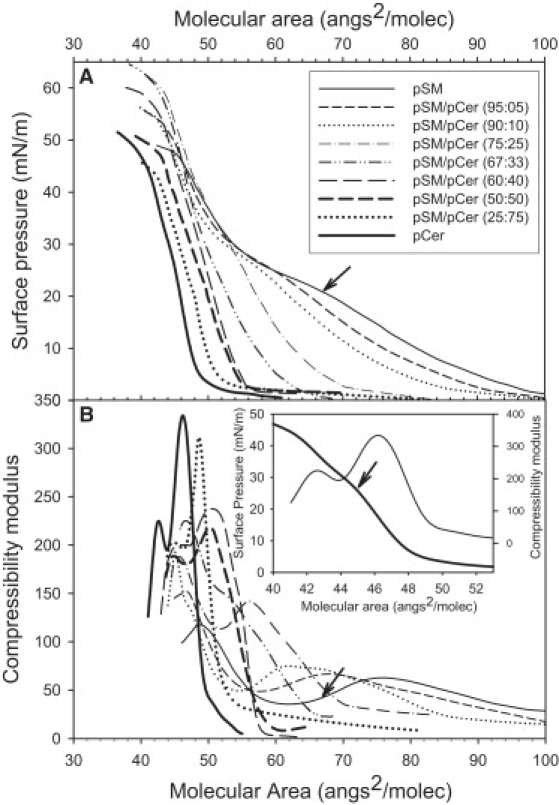
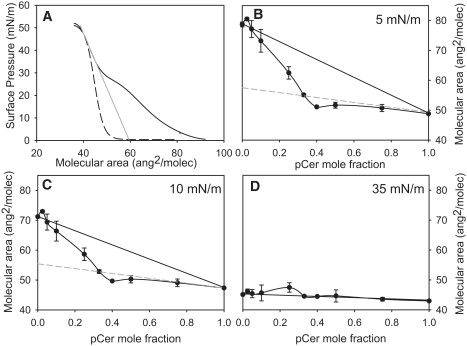
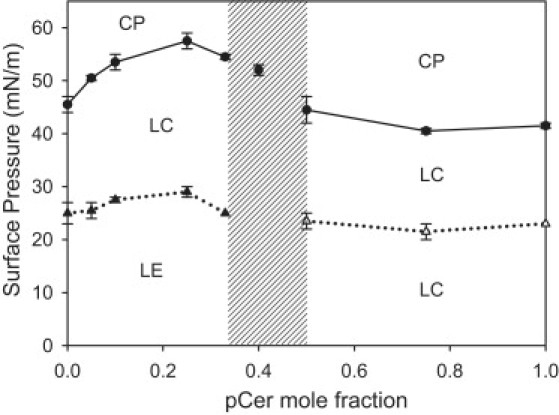
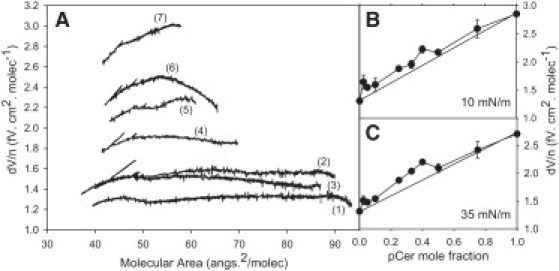
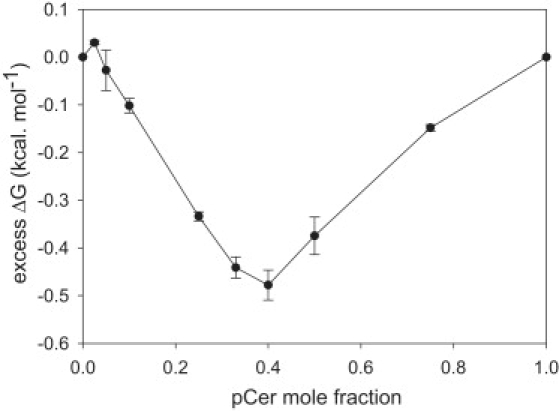
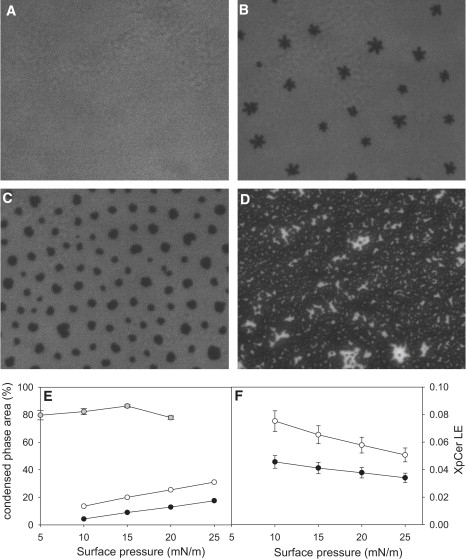
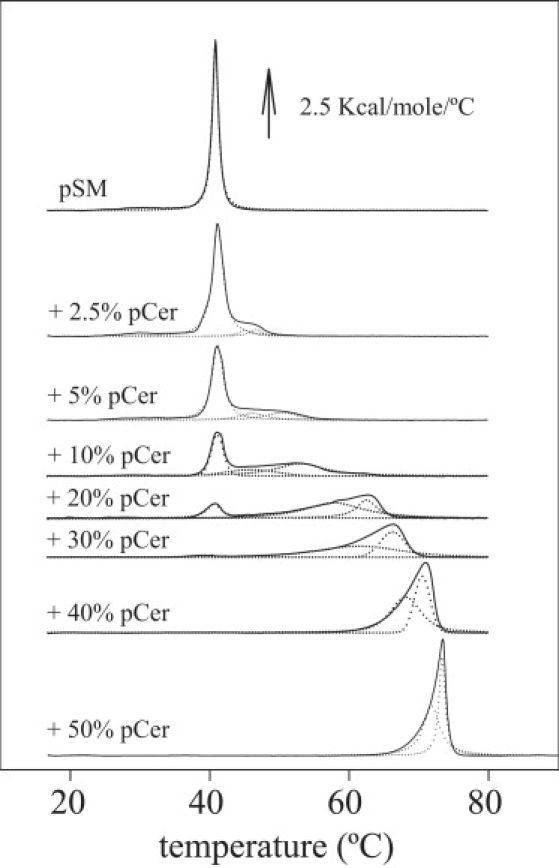
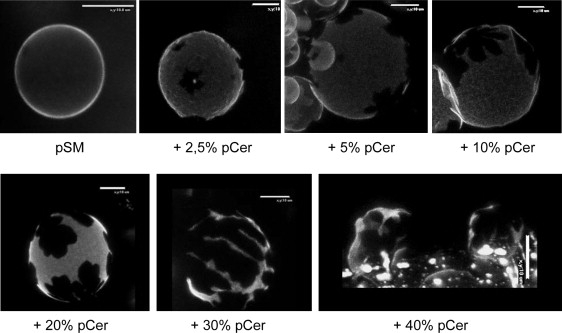
A combination of lipid monolayer- and bilayer-based model systems has been applied to explore in detail the interactions between and organization of palmitoylsphingomyelin (pSM) and the related lipid palmitoylceramide (pCer). Langmuir balance measurements of the binary mixture reveal favorable interactions between the lipid molecules. A thermodynamically stable point is observed in the range approximately 30-40 mol % pCer. The pSM monolayer undergoes hyperpolarization and condensation with small concentrations of pCer, narrowing the liquid-expanded (LE) to liquid-condensed (LC) pSM main phase transition by inducing intermolecular interactions and chain ordering. Beyond this point, the phase diagram no longer reveals the presence of the pSM-enriched phase. Differential scanning calorimetry (DSC) of multilamellar vesicles reveals a widening of the pSM main gel-fluid phase transition (41 degrees C) upon pCer incorporation, with formation of a further endotherm at higher temperatures that can be deconvoluted into two components. DSC data reflect the presence of pCer-enriched domains coexisting, in different proportions, with a pSM-enriched phase. The pSM-enriched phase is no longer detected in DSC thermograms containing >30 mol % pCer. Direct domain visualization has been carried out by fluorescence techniques on both lipid model systems. Epifluorescence microscopy of mixed monolayers at low pCer content shows concentration-dependent, morphologically different pCer-enriched LC domain formation over a pSM-enriched LE phase, in which pCer content close to 5 and 30 mol % can be determined for the LE and LC phases, respectively. In addition, fluorescence confocal microscopy of giant vesicles further confirms the formation of segregated pCer-enriched lipid domains. Vesicles cannot form at >40 mol % pCer content. Altogether, the presence of at least two immiscible phase-segregated pSM-pCer mixtures of different compositions is proposed at high pSM content. A condensed phase (with domains segregated from the liquid-expanded phase) showing enhanced thermodynamic stability occurs near a compositional ratio of 2:1 (pSM/pCer). These observations become significant on the basis of the ceramide-induced microdomain aggregation and platform formation upon sphingomyelinase enzymatic activity on cellular membranes.
Figures
Similar articles
-
Cholesterol displaces palmitoylceramide from its tight packing with palmitoylsphingomyelin in the absence of a liquid-disordered phase.Biophys J. 2010 Aug 9;99(4):1119-28. doi: 10.1016/j.bpj.2010.05.032. Biophys J. 2010. PMID: 20712995 Free PMC article.
-
Homogeneous and Heterogeneous Bilayers of Ternary Lipid Compositions Containing Equimolar Ceramide and Cholesterol.Langmuir. 2019 Apr 16;35(15):5305-5315. doi: 10.1021/acs.langmuir.9b00324. Epub 2019 Apr 8. Langmuir. 2019. PMID: 30924341
-
Lateral Segregation of Palmitoyl Ceramide-1-Phosphate in Simple and Complex Bilayers.Biophys J. 2019 Jul 9;117(1):36-45. doi: 10.1016/j.bpj.2019.05.015. Epub 2019 May 21. Biophys J. 2019. PMID: 31133285 Free PMC article.
-
Differential scanning calorimetry in drug-membrane interactions.Biochem Biophys Res Commun. 2024 May 21;709:149806. doi: 10.1016/j.bbrc.2024.149806. Epub 2024 Mar 19. Biochem Biophys Res Commun. 2024. PMID: 38579619 Review.
-
Fluorescence methods to detect phase boundaries in lipid bilayer mixtures.Biochim Biophys Acta. 2005 Dec 30;1746(3):186-92. doi: 10.1016/j.bbamcr.2005.05.008. Epub 2005 Jun 15. Biochim Biophys Acta. 2005. PMID: 15992943 Free PMC article. Review.
Cited by
-
The many faces (and phases) of ceramide and sphingomyelin I - single lipids.Biophys Rev. 2017 Oct;9(5):589-600. doi: 10.1007/s12551-017-0297-z. Epub 2017 Aug 16. Biophys Rev. 2017. PMID: 28815463 Free PMC article. Review.
-
Ceramide-C16 Is a Versatile Modulator of Phosphatidylethanolamine Polymorphism.Biophys J. 2017 Jun 6;112(11):2357-2366. doi: 10.1016/j.bpj.2017.04.047. Biophys J. 2017. PMID: 28591608 Free PMC article.
-
Cholesterol displaces palmitoylceramide from its tight packing with palmitoylsphingomyelin in the absence of a liquid-disordered phase.Biophys J. 2010 Aug 9;99(4):1119-28. doi: 10.1016/j.bpj.2010.05.032. Biophys J. 2010. PMID: 20712995 Free PMC article.
-
Biophysical properties of novel 1-deoxy-(dihydro)ceramides occurring in mammalian cells.Biophys J. 2014 Dec 16;107(12):2850-2859. doi: 10.1016/j.bpj.2014.10.010. Biophys J. 2014. PMID: 25517151 Free PMC article.
-
Solid character of membrane ceramides: a surface rheology study of their mixtures with sphingomyelin.Biophys J. 2011 Dec 7;101(11):2721-30. doi: 10.1016/j.bpj.2011.10.049. Biophys J. 2011. PMID: 22261061 Free PMC article.
References
-
- Hannun Y.A., Loomis C.R., Merrill A.H., Bell R.M. Sphingosine inhibition of protein kinase C activity and of phorbol dibutyrate binding in vitro and in human platelets. J. Biol. Chem. 1986;261:12604–12609. - PubMed
-
- Kolesnick R.N. 1,2-diacylglycerols but not phorbol esters stimulate sphingomyelin hydrolysis in GH3 pituitary cells. J. Biol. Chem. 1987;262:16759–16762. - PubMed
-
- Kolesnick R.N., Goñi F.M., Alonso A. Compartmentalization of ceramide signaling: physical foundations and biological effects. J. Cell. Physiol. 2000;184:285–300. - PubMed
-
- Maggio B. The surface behavior of glycosphingolipids in biomembranes: a new frontier of molecular ecology. Prog. Biophys. Mol. Biol. 1994;62:55–117. - PubMed
Publication types
MeSH terms
Substances
LinkOut - more resources
Full Text Sources
Miscellaneous
