

A second look at mini-protein stability: analysis of FSD-1 using circular dichroism, differential scanning calorimetry, and simulations
- PMID: 19917235
- PMCID: PMC2776296
- DOI: 10.1016/j.bpj.2009.08.046
A second look at mini-protein stability: analysis of FSD-1 using circular dichroism, differential scanning calorimetry, and simulations
Abstract
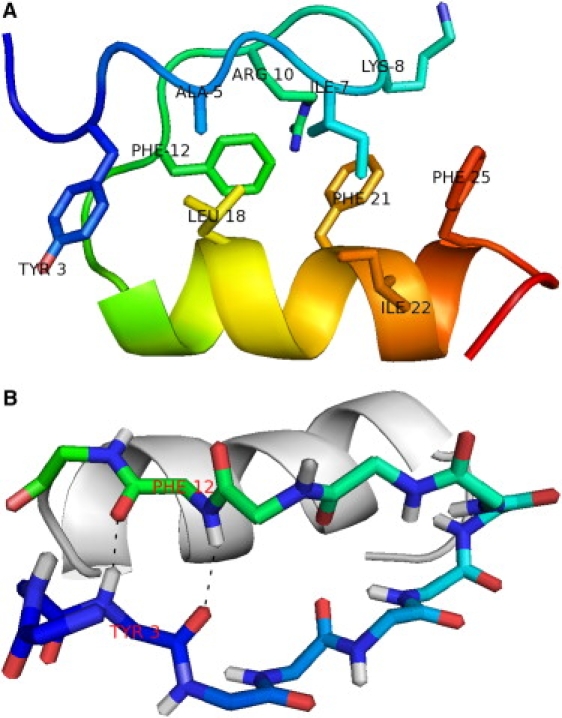
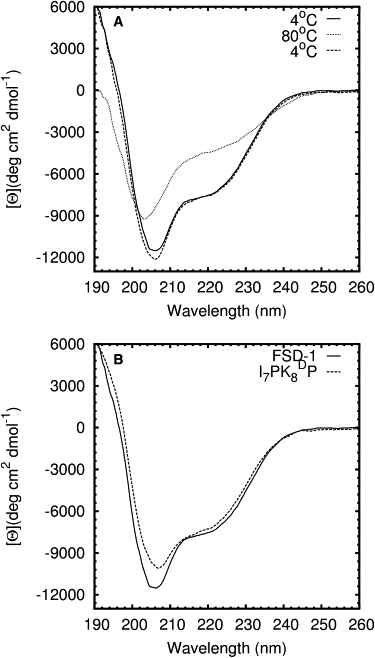
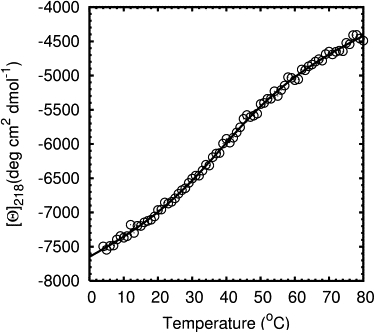
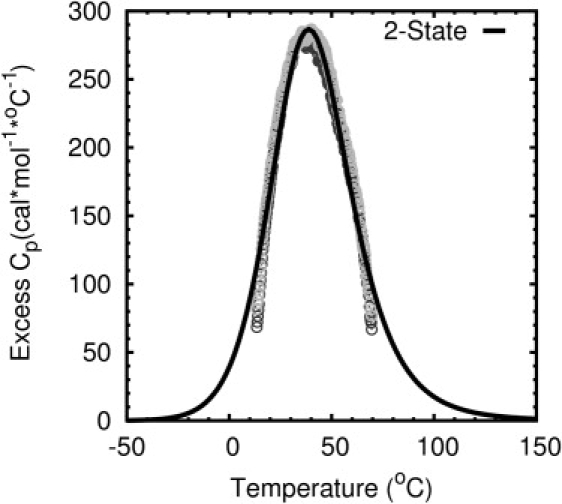
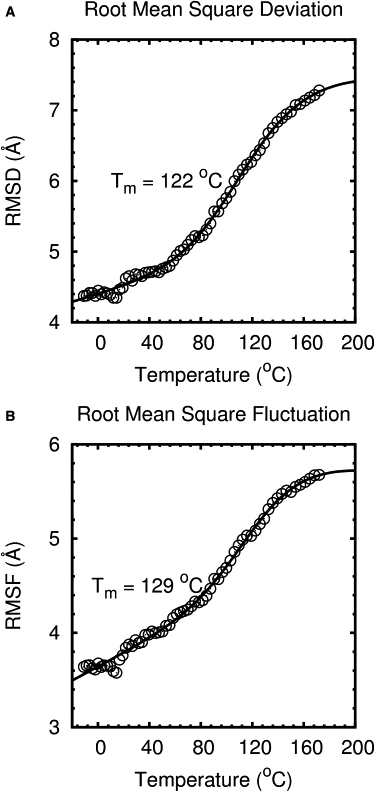
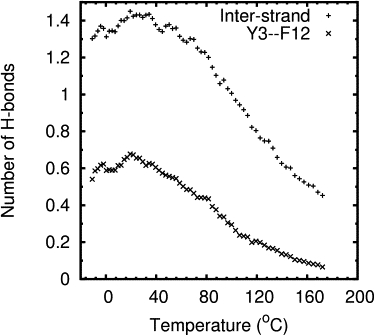
Mini-proteins that contain <50 amino acids often serve as model systems for studying protein folding because their small size makes long timescale simulations possible. However, not all mini-proteins are created equal. The stability and structure of FSD-1, a 28-residue mini-protein that adopted the betabetaalpha zinc-finger motif independent of zinc binding, was investigated using circular dichroism, differential scanning calorimetry, and replica-exchange molecular dynamics. The broad melting transition of FSD-1, similar to that of a helix-to-coil transition, was observed by using circular dichroism, differential scanning calorimetry, and replica-exchange molecular dynamics. The N-terminal beta-hairpin was found to be flexible. The FSD-1 apparent melting temperature of 41 degrees C may be a reflection of the melting of its alpha-helical segment instead of the entire protein. Thus, despite its attractiveness due to small size and purposefully designed helix, sheet, and turn structures, the status of FSD-1 as a model system for studying protein folding should be reconsidered.
Figures
Similar articles
-
Understanding the folding and stability of a zinc finger-based full sequence design protein with replica exchange molecular dynamics simulations.Proteins. 2007 May 1;67(2):338-49. doi: 10.1002/prot.21312. Proteins. 2007. PMID: 17285627
-
Folding of a Zinc-Finger ββα-Motif Investigated Using Two-Dimensional and Time-Resolved Vibrational Spectroscopy.J Phys Chem B. 2016 Nov 3;120(43):11151-11158. doi: 10.1021/acs.jpcb.6b08883. Epub 2016 Oct 21. J Phys Chem B. 2016. PMID: 27723346
-
Folding models of mini-protein FSD-1.J Phys Chem B. 2012 Jun 14;116(23):6916-22. doi: 10.1021/jp300074f. Epub 2012 Mar 28. J Phys Chem B. 2012. PMID: 22417236
-
The beta-beta-alpha fold: explorations in sequence space.J Mol Biol. 2001 Apr 13;307(5):1411-8. doi: 10.1006/jmbi.2000.4345. J Mol Biol. 2001. PMID: 11292351
-
Equilibrium structure and folding of a helix-forming peptide: circular dichroism measurements and replica-exchange molecular dynamics simulations.Biophys J. 2004 Dec;87(6):3786-98. doi: 10.1529/biophysj.104.045419. Epub 2004 Aug 31. Biophys J. 2004. PMID: 15339816 Free PMC article.
Cited by
-
Finding multiple reaction pathways via global optimization of action.Nat Commun. 2017 May 26;8:15443. doi: 10.1038/ncomms15443. Nat Commun. 2017. PMID: 28548089 Free PMC article.
-
Stability and folding behavior analysis of zinc-finger using simple models.Int J Mol Sci. 2010 Oct 19;11(10):4014-34. doi: 10.3390/ijms11104014. Int J Mol Sci. 2010. PMID: 21152317 Free PMC article.
-
Effects of protein size, thermodynamic stability, and net charge on cotranslational folding on the ribosome.Proc Natl Acad Sci U S A. 2018 Oct 2;115(40):E9280-E9287. doi: 10.1073/pnas.1812756115. Epub 2018 Sep 17. Proc Natl Acad Sci U S A. 2018. PMID: 30224455 Free PMC article.
-
On the origins of the weak folding cooperativity of a designed ββα ultrafast protein FSD-1.PLoS Comput Biol. 2010 Nov 18;6(11):e1000998. doi: 10.1371/journal.pcbi.1000998. PLoS Comput Biol. 2010. PMID: 21124953 Free PMC article.
References
-
- Snow C.D., Sorin E.J., Rhee Y.M., Pande V.S. How well can simulation predict protein folding kinetics and thermodynamics? Annu. Rev. Biophys. Biomol. Struct. 2005;34:43–69. - PubMed
-
- Sugita Y., Okamoto Y. Replica-exchange molecular dynamics method for protein folding. Chem. Phys. Lett. 1999;314:141–151.
-
- Sanbonmatsu K.Y., Garcia A.E. Structure of Met-enkephalin in explicit aqueous solution using replica exchange molecular dynamics. Proteins. 2002;46:225–234. - PubMed
-
- Seibert M.M., Patriksson A., Hess B., van der Spoel D. Reproducible polypeptide folding and structure prediction using molecular dynamics simulations. J. Mol. Biol. 2005;354:173–183. - PubMed
-
- Struthers M., Ottesen J.J., Imperiali B. Design and NMR analyses of compact, independently folded ββα motifs. Fold. Des. 1998;3:95–103. - PubMed
Publication types
MeSH terms
Substances
Grants and funding
LinkOut - more resources
Full Text Sources
