. 2009 Nov 19;6(5):470-81.
doi: 10.1016/j.chom.2009.10.007.

Inflammatory monocytes facilitate adaptive CD4 T cell responses during respiratory fungal infection

Affiliations

Inflammatory monocytes facilitate adaptive CD4 T cell responses during respiratory fungal infection

Tobias M Hohl et al. Cell Host Microbe. .

Abstract

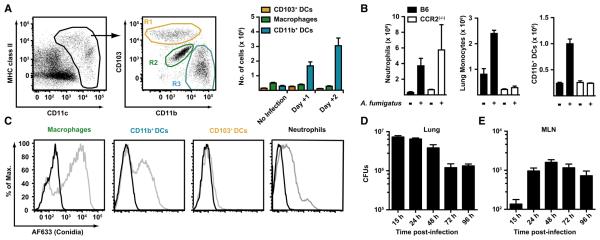
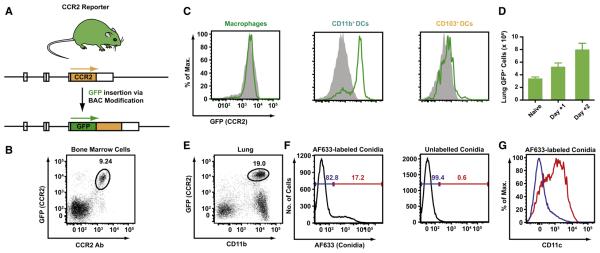
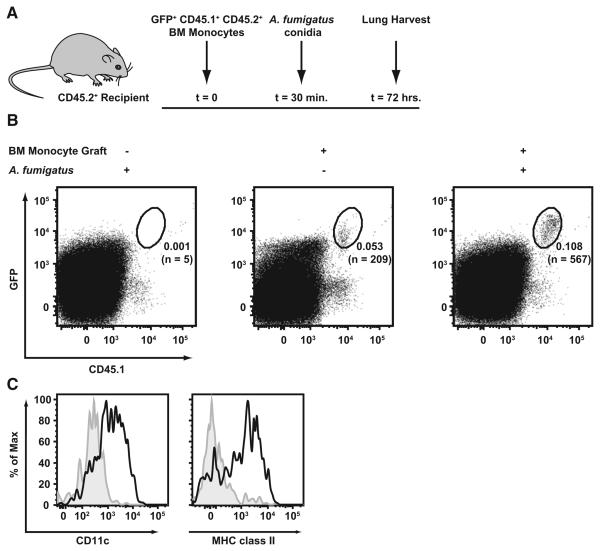
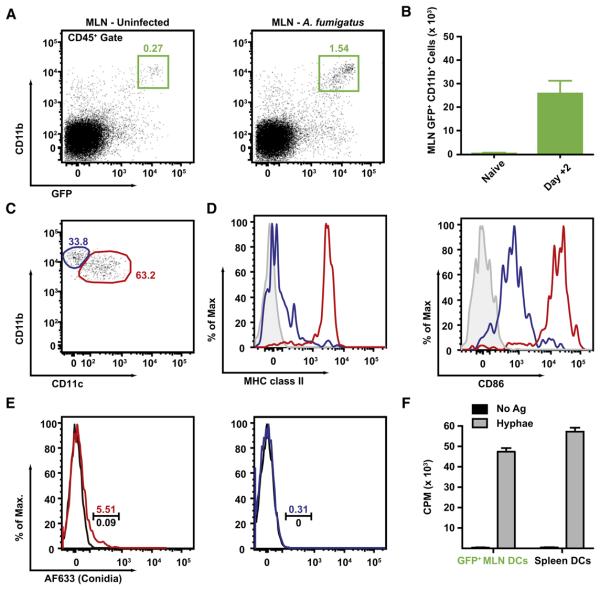
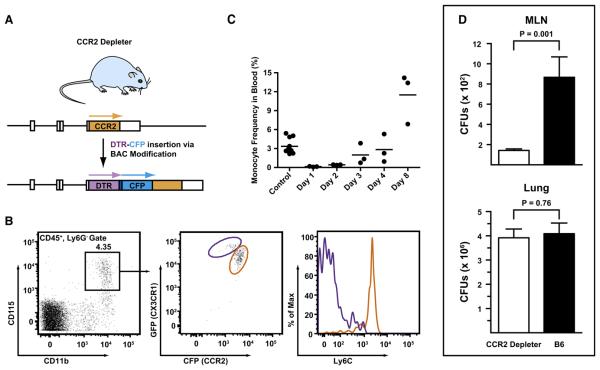
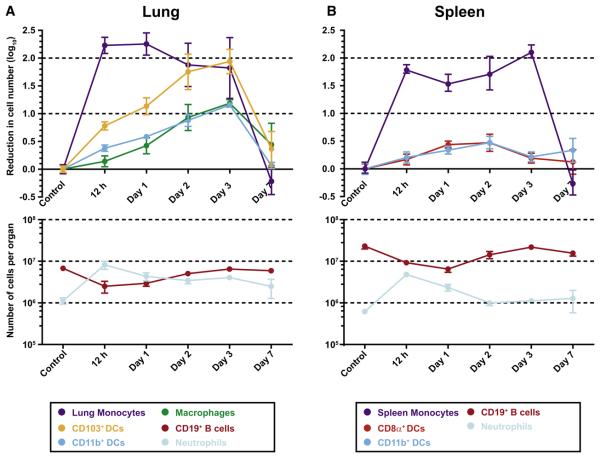
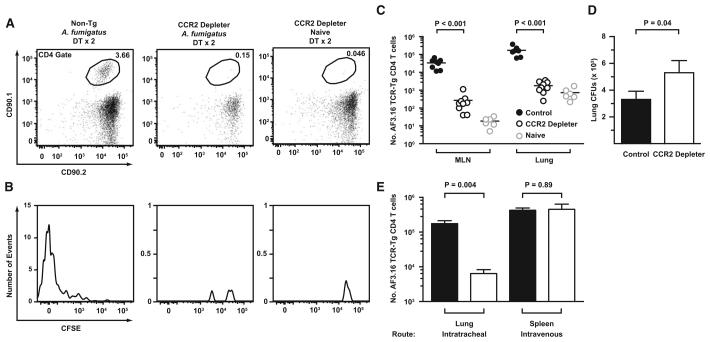
Aspergillus fumigatus, a ubiquitous fungus, causes invasive disease in immunocompromised humans. Although monocytes and antigen-specific CD4 T cells contribute to defense against inhaled fungal spores, how these cells interact during infection remains undefined. Investigating the role of inflammatory monocytes and monocyte-derived dendritic cells during fungal infection, we find that A. fumigatus infection induces an influx of chemokine receptor CCR2- and Ly6C-expressing inflammatory monocytes into lungs and draining lymph nodes. Depletion of CCR2(+) cells reduced A. fumigatus conidial transport from lungs to draining lymph nodes, abolished CD4 T cell priming following respiratory challenge, and impaired pulmonary fungal clearance. In contrast, depletion of CCR2(+)Ly6C(hi) monocytes during systemic fungal infection did not prevent CD4 T cell priming in the spleen. Our findings demonstrate that pulmonary CD4 T cell responses to inhaled spores require CCR2(+)Ly6C(hi) monocytes and their derivatives, revealing a compartmentally restricted function for these cells in adaptive respiratory immune responses.


Figures

Figure 1
Figure 1. Inflammatory Cell Recruitment and Conidial MLN Transport during Respiratory Fungal Infection
(A) Gating strategy to define cell populations in the mouse lung. CD45+CD11c+MHC class II variable cells from naive C57BL/6 mice were classified as CD103+ DCs (R1, yellow gate), autofluorescent CD11c+ macrophages (R2, green gate), and CD11b+ DCs (R3, blue gate) as in Sung et al. (2006). (B–D) C57BL/6 mice (black bars) or Ccr2−/− mice (white bars) were infected with 1–2 × 10⁷ conidia and euthanized at the indicated time points. Single-cell lung suspensions were enumerated and multiplied by the frequency of CD11b+Ly6C+Ly6G+ neutrophils, CD11b+Ly6C+Ly6G monocytes, or CD11b+ DCs in the lung. The bar graphs in (B) show the average number (+ SEM) of the indicated cell populations. One of three representative experiments is shown with 3–4 mice per group. (C) The histograms depict the uptake of AF633-labeled conidia (gray lines) or unlabelled conidia (black lines) by the indicated lung cell subsets 2 days postinfection. (D) C57BL/6 mice were infected with 1–2 × 10⁷ conidia via the i.t. route, and CFUs in the MLN (black columns) and lungs (white columns) were determined at the indicated time points. The bar graphs show the average number (+ SEM) of CFUs per time point (n = 5/time point) from a representative experiment.
Figure 2
Figure 2. Characterization of CCR2 Reporter Mice
(A) Generation of CCR2 reporter mice. A BAC was modified to encode enhanced GFP under control of the murine CCR2 promoter. A stop codon was introduced at the 3′ transgene terminus followed by a single nucleotide deletion. Arrows indicate the expected translation products. (B) The plot shows GFP expression and CCR2 Ab staining by CCR2 reporter BM cells. (C) The histograms show GFP expression by lung DC subsets and macrophages isolated from naive CCR2 reporter (green lines) or nontransgenic C57BL/6 littermates (solid gray histograms). (D) The bar graphs show the number (+ SEM) of lung GFP+ cells in CCR2 reporter mice (n = 5/group) at the indicated time points postinfection. (E–G) The plot in (E) shows CD11b expression by GFP+ lung cells in day +2-infected CCR2 reporter mice (black gate). Lung GFP+CD11b+ cells (A, blue gate) were examined for uptake of AF633-labeled (F, left histogram) or unlabeled (F, right histogram) conidia. The blue and red gates indicate the frequency of AF633 and AF633+ cells in each histogram, respectively. (G) CD11c expression by AF633 (blue line) and AF633+ (red line) cell subsets among lung GFP+CD11b+ cells isolated from infected CCR2 reporter mice.
Figure 3
Figure 3. Bone Marrow Monocytes Differentiate into Lung CD11b+ DCs during Respiratory Fungal Infection
(A) Overview of experimental scheme. Recipient CD45.2+ mice received 8 × 10⁵ flow-sorted CD45.1+CD11cCD19Thy1.2NK1.1Ter119−-GFP+ BM cells from CCR2 reporter mice prior to infection. (B) Representative plots of single-cell lung suspensions from A. fumigatus-infected (left, right) or uninfected mice (middle) that received BM monocytes (middle, right) or no graft (left). The plots are gated on CD45.2+ cells (from 106 total recorded lung cells), and the frequency of CD45.1+GFP+ cells and the number of events in each gate is indicated. (C) The histograms depict CD11c and MHC class II expression by gated cells from infected (black line) or uninfected mice (filled gray histogram).
Figure 4
Figure 4. Influx of GFP+CD11b+ DCs in the MLN during Respiratory Fungal Infection
(A–D) GFP+CD11b+ cells accumulate in the MLN of A. fumigatus-infected mice. The plots in (A) and the bar graph in (B) show the frequency (A) and average number (+ SEM) (B) of MLN GFP+CD11b+ cells in infected (day +2) or naive CCR2 reporter mice. (C) MLN GFP+CD11b+ cells isolated from infected mice can be divided into two subsets on the basis of CD11c expression (blue and red gates). (D) The histograms show MHC class II and CD86 expression by the CD11c+ (red line) or CD11c subset of MLN GFP+CD11b+ cells (blue line). Isotype control staining is shown in the gray histograms. One of three (A and B) or two (C and D) experiments with 3–4 mice per group is shown. (D) GFP+CD11b+ DCs are associated with fluorescent conidia. CCR2 reporter mice were infected with AF633-labeled (colored lines) or unlabeled conidia (black lines). MLN GFP+CD11b+ cells were divided into CD11c+ DCs (red lines) or CD11c monocytes (blue lines) and analyzed for AF633 fluorescence. The gate indicates the frequency of AF633+ cells. (E) MLN GFP+CD11b+ cells can prime naive Ag-specific CD4 T cells. 3.5 × 10⁴ flow-sorted MLN GFP+CD11b+ cells harvested from infected CCR2 reporter mice or 5 × 10⁴ MACS-enriched CD11c+ DCs from Ftl3L-treated mice were cultured for 48 hr with 5 × 10⁴ Af3.16 CD4 T cells with (gray bars) or without (black bars) hyphal antigens prior to assessment of CD4 T cell proliferation by [3H]-thymidine incorporation.
Figure 5
Figure 5. Abrogation of Conidial MLN Transport in CCR2 Depleter
(A) Overview of BAC transgene. The BAC clone RP23-182D4 was modified to encode a simian DTR followed by a -(GSG)3GTG- linker, a 19 residue aphthovirus 2A cleavage site (-APVKQTLNFDLLKLAGDVESNPGP-) (Donnelly et al., 2001), and enhanced CFP under control of the CCR2 promoter. A stop codon was introduced at the 3′ transgene terminus followed by a single nucleotide deletion. Arrows indicate the expected translation products. (B and C) Transgene expression by monocytes and sensitivity to DT. Transgene expression by monocytes and ablation by DT administration. (B) CD115+ blood monocytes (black gate, left) from CX3CR1 (gfp/+) CCR2 reporter mice were analyzed for CFP, GFP, and Ly6C expression. In the left panel, the purple and orange gates indicate GFPhiCFPlo and GFPloCFPhi monocytes, respectively. Ly6C expression by both subsets is shown in the histogram on the right. (C) CCR2 depleter mice were treated were 10 ng/g body weight DT via the i.p. route. The graph shows the percentage of CD115+ monocytes among CD45+ blood leukocytes at the indicate time points after DT treatment. Control mice include CCR2 depleter mice that did not receive DT and DT-treated nontransgenic littermates. One of two (B) or three (C) representative experiments is shown. (D) CCR2 depleter mice (black bars) or control C57BL/6 mice (white bars) were treated with DT on day −1 and infected with 1–2 × 10⁷ conidia on day 0. The histograms show the number (+ SEM) of MLN and lung CFUs 48 hr postinfection (n = 12–13/group).
Figure 6
Figure 6. Depletion of Lung and Spleen DC Subsets in CCR2 Depleter Mice
(A and B) CCR2 depleter mice received no toxin (control) or 10 ng/g body weight DT at day 0. At the indicated time points, mice were euthanized, and single-cell suspensions from the lungs (A) and spleens (B) were enumerated and analyzed by flow cytometry to determine toxin-induced cell depletion. For the top panel in (A), the baseline lung monocyte, CD103+ DC, CD11b+ DC, and lung macrophage counts (± SEM) were (in log10 units) 6.167 ± 5.645, 5.401 ± 4.557, 5.786 ± 4.825, and 5.512 ± 4.781, respectively. For the top panel in (B), the baseline spleen monocyte, CD8α+ DC, and CD11b+ DC counts (± SEM) were 5.746 ± 5.115, 4.978 ± 4.317, and 5.620 ± 4.916, respectively. One of three representative experiments is shown with 3–4 mice per group.
Figure 7
Figure 7. Depletion of CCR2+ Cells Impairs CD4 T Cell Priming and Fungal Clearance in the Lung
(A–D) CCR2 depleter or nontransgenic littermates received 105 CFSE-labeled Af3.16 CD4 T cells on day −1, DT on day −1 and day +1, and 1–2 × 10⁷ A. fumigatus conidia i.t. on day 0. The plots show representative examples of (A) the frequency of CD90.1+CD90.2+ Af3.16 TCR-Tg CD4 cells within the MLN CD4 gate and (B) the CFSE dilution profile of gated Af3.16 CD4 T cells. (C and D) The plots show (C) the number of MLN and lung Af3.16 CD4 T cells and (D) the average lung CFUs (± SEM) from DT-treated infected control (black circles or bar; n = 9), DT-treated infected CCR2 depleter (white circles or bar; n = 8), or DT-treated uninfected mice (gray circles; n = 6) 6 days postinfection from two pooled experiments. (E) CCR2 depleter mice were treated with no DT (black bars) or one dose of DT (white bars) on day −1 and infected with A. fumigatus via the i.t. or i.v. route (day 0). The graph shows the average number of Af3.16 CD4 T cells (± SEM) in the lung and spleen 6 days postinfection.

References

    1. Aldridge JR, Jr., Moseley CE, Boltz DA, Negovetich NJ, Reynolds C, Franks J, Brown SA, Doherty PC, Webster RG, Thomas PG. TNF/iNOS-producing dendritic cells are the necessary evil of lethal influenza virus infection. Proc. Natl. Acad. Sci. USA. 2009;106:5306–5311. - PMC - PubMed
    1. Auffray C, Fogg DK, Narni-Mancinelli E, Senechal B, Trouillet C, Saederup N, Leemput J, Bigot K, Campisi L, Abitbol M, et al. CX3CR1+ CD115+ CD135+ common macrophage/DC precursors and the role of CX3CR1 in their response to inflammation. J. Exp. Med. 2009a;206:595–606. - PMC - PubMed
    1. Auffray C, Sieweke MH, Geissmann F. Blood monocytes: development, heterogeneity, and relationship with dendritic cells. Annu. Rev. Immunol. 2009b;27:669–692. - PubMed
    1. Beck O, Topp MS, Koehl U, Roilides E, Simitsopoulou M, Hanisch M, Sarfati J, Latge JP, Klingebiel T, Einsele H, Lehrnbecher T. Generation of highly purified and functionally active human TH1 cells against Aspergillus fumigatus. Blood. 2006;107:2562–2569. - PubMed
    1. Belz GT, Smith CM, Kleinert L, Reading P, Brooks A, Shortman K, Carbone FR, Heath WR. Distinct migrating and nonmigrating dendritic cell populations are involved in MHC class I-restricted antigen presentation after lung infection with virus. Proc. Natl. Acad. Sci. USA. 2004;101:8670–8675. - PMC - PubMed

Publication types

MeSH terms