How Escherichia coli is equipped to oxidize hydrogen under different redox conditions
- PMID: 19917611
- PMCID: PMC2823535
- DOI: 10.1074/jbc.M109.067751
How Escherichia coli is equipped to oxidize hydrogen under different redox conditions
Erratum in
- J Biol Chem. 2010 Jun 25;285(26):20421
Abstract
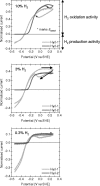
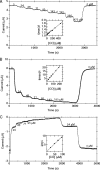
The enterobacterium Escherichia coli synthesizes two H(2) uptake enzymes, Hyd-1 and Hyd-2. We show using precise electrochemical kinetic measurements that the properties of Hyd-1 and Hyd-2 contrast strikingly, and may be individually optimized to function under distinct environmental conditions. Hyd-2 is well suited for fast and efficient catalysis in more reducing environments, to the extent that in vitro it behaves as a bidirectional hydrogenase. In contrast, Hyd-1 is active for H(2) oxidation under more oxidizing conditions and cannot function in reverse. Importantly, Hyd-1 is O(2) tolerant and can oxidize H(2) in the presence of air, whereas Hyd-2 is ineffective for H(2) oxidation under aerobic conditions. The results have direct relevance for physiological roles of Hyd-1 and Hyd-2, which are expressed in different phases of growth. The properties that we report suggest distinct technological applications of these contrasting enzymes.
Figures


Similar articles
-
Efficient electron transfer from hydrogen to benzyl viologen by the [NiFe]-hydrogenases of Escherichia coli is dependent on the coexpression of the iron-sulfur cluster-containing small subunit.Arch Microbiol. 2011 Dec;193(12):893-903. doi: 10.1007/s00203-011-0726-5. Epub 2011 Jun 30. Arch Microbiol. 2011. PMID: 21717143
-
Iron restriction induces preferential down-regulation of H(2)-consuming over H(2)-evolving reactions during fermentative growth of Escherichia coli.BMC Microbiol. 2011 Aug 31;11:196. doi: 10.1186/1471-2180-11-196. BMC Microbiol. 2011. PMID: 21880124 Free PMC article.
-
Multiple and reversible hydrogenases for hydrogen production by Escherichia coli: dependence on fermentation substrate, pH and the F(0)F(1)-ATPase.Crit Rev Biochem Mol Biol. 2012 May-Jun;47(3):236-49. doi: 10.3109/10409238.2012.655375. Epub 2012 Feb 7. Crit Rev Biochem Mol Biol. 2012. PMID: 22313414 Review.
-
The Model [NiFe]-Hydrogenases of Escherichia coli.Adv Microb Physiol. 2016;68:433-507. doi: 10.1016/bs.ampbs.2016.02.008. Epub 2016 Mar 23. Adv Microb Physiol. 2016. PMID: 27134027 Review.
-
How Salmonella oxidises H(2) under aerobic conditions.FEBS Lett. 2012 Mar 9;586(5):536-44. doi: 10.1016/j.febslet.2011.07.044. Epub 2011 Aug 5. FEBS Lett. 2012. PMID: 21827758
Cited by
-
ArcA and AppY antagonize IscR repression of hydrogenase-1 expression under anaerobic conditions, revealing a novel mode of O2 regulation of gene expression in Escherichia coli.J Bacteriol. 2012 Dec;194(24):6892-9. doi: 10.1128/JB.01757-12. Epub 2012 Oct 12. J Bacteriol. 2012. PMID: 23065979 Free PMC article.
-
Amino acid modified Ni catalyst exhibits reversible H2 oxidation/production over a broad pH range at elevated temperatures.Proc Natl Acad Sci U S A. 2014 Nov 18;111(46):16286-91. doi: 10.1073/pnas.1416381111. Epub 2014 Nov 3. Proc Natl Acad Sci U S A. 2014. PMID: 25368196 Free PMC article.
-
Improved purification, crystallization and crystallographic study of Hyd-2-type [NiFe]-hydrogenase from Citrobacter sp. S-77.Acta Crystallogr F Struct Biol Commun. 2016 Jan;72(Pt 1):53-8. doi: 10.1107/S2053230X15024152. Epub 2016 Jan 1. Acta Crystallogr F Struct Biol Commun. 2016. PMID: 26750485 Free PMC article.
-
Cyanobacterial hydrogenases and hydrogen metabolism revisited: recent progress and future prospects.Int J Mol Sci. 2015 May 8;16(5):10537-61. doi: 10.3390/ijms160510537. Int J Mol Sci. 2015. PMID: 26006225 Free PMC article. Review.
-
Silver-coated magnetic nanocomposites induce growth inhibition and protein changes in foodborne bacteria.Sci Rep. 2019 Nov 25;9(1):17499. doi: 10.1038/s41598-019-53080-x. Sci Rep. 2019. PMID: 31767879 Free PMC article.
References
-
- Vignais P. M., Billoud B. (2007) Chem. Rev. 107, 4206–4272 - PubMed
-
- Fontecilla-Camps J. C., Volbeda A., Cavazza C., Nicolet Y. (2007) Chem. Rev. 107, 4273–4303 - PubMed
-
- Lamle S. E., Albracht S. P., Armstrong F. A. (2004) J. Am. Chem. Soc. 126, 14899–14909 - PubMed
-
- Vincent K. A., Parkin A., Lenz O., Albracht S. P., Fontecilla-Camps J. C., Cammack R., Friedrich B., Armstrong F. A. (2005) J. Am. Chem. Soc. 127, 18179–18189 - PubMed
-
- van Gastel M., Stein M., Brecht M., Schröder O., Lendzian F., Bittl R., Ogata H., Higuchi Y., Lubitz W. (2006) J. Biol. Inorg. Chem. 11, 41–51 - PubMed
Publication types
MeSH terms
Substances
Grants and funding
- P15018/BB_/Biotechnology and Biological Sciences Research Council/United Kingdom
- BB/H001190/1/BB_/Biotechnology and Biological Sciences Research Council/United Kingdom
- BB/D52222X/BB_/Biotechnology and Biological Sciences Research Council/United Kingdom
- G117/519/MRC_/Medical Research Council/United Kingdom
- BB/H003878/1/BB_/Biotechnology and Biological Sciences Research Council/United Kingdom
LinkOut - more resources
Full Text Sources
Other Literature Sources
Molecular Biology Databases

