. 2009 Dec 1;183(11):7150-60.
doi: 10.4049/jimmunol.0901481. Epub 2009 Nov 16.

Neonatal innate TLR-mediated responses are distinct from those of adults

Affiliations

Neonatal innate TLR-mediated responses are distinct from those of adults

Tobias R Kollmann et al. J Immunol. .

Abstract

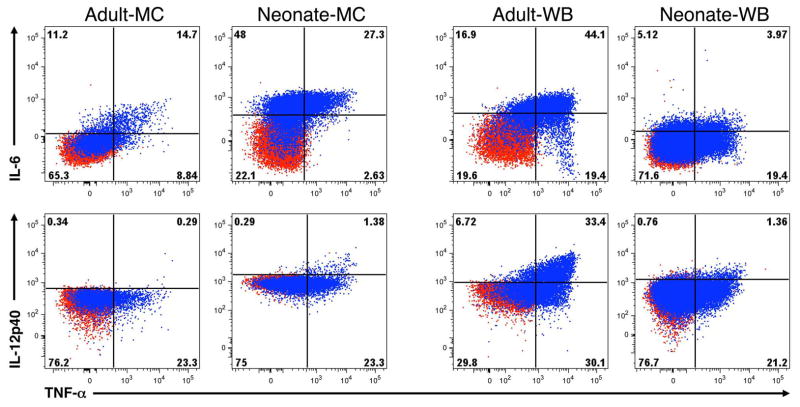
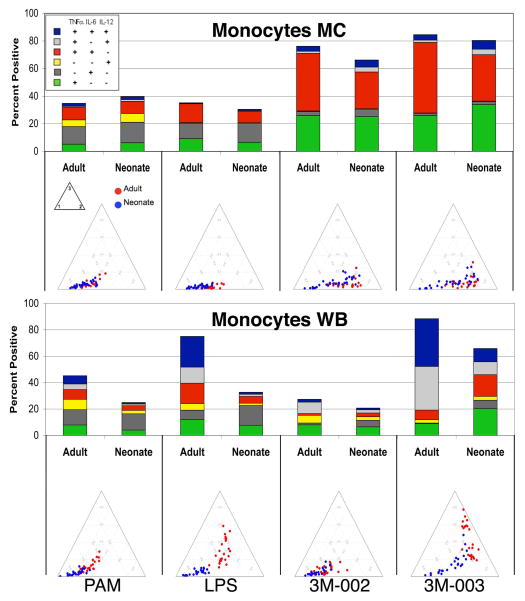
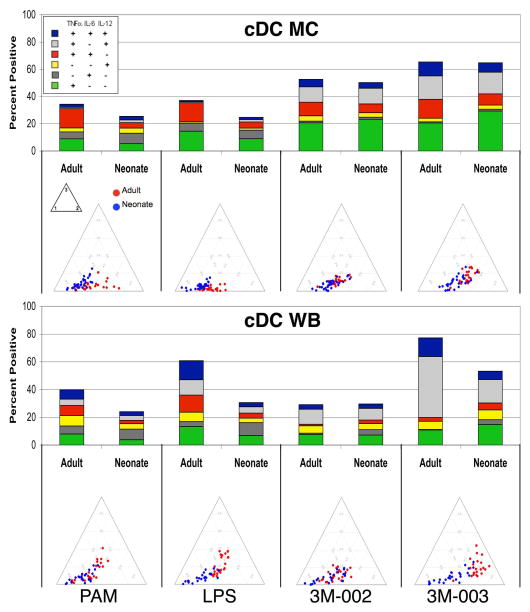
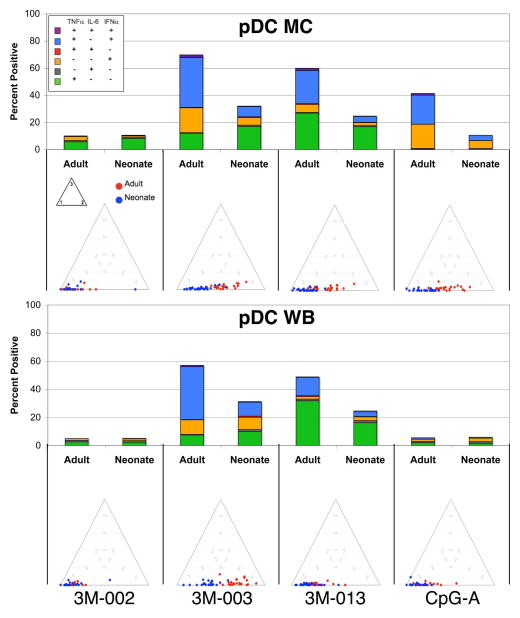
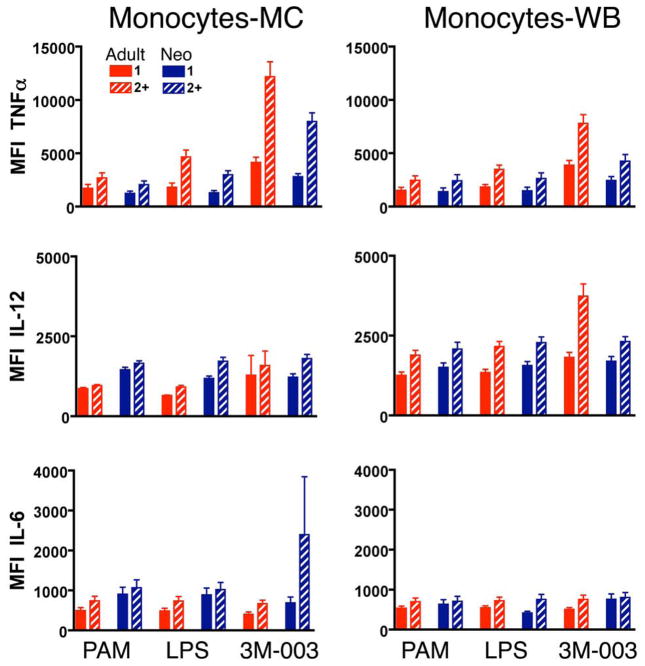
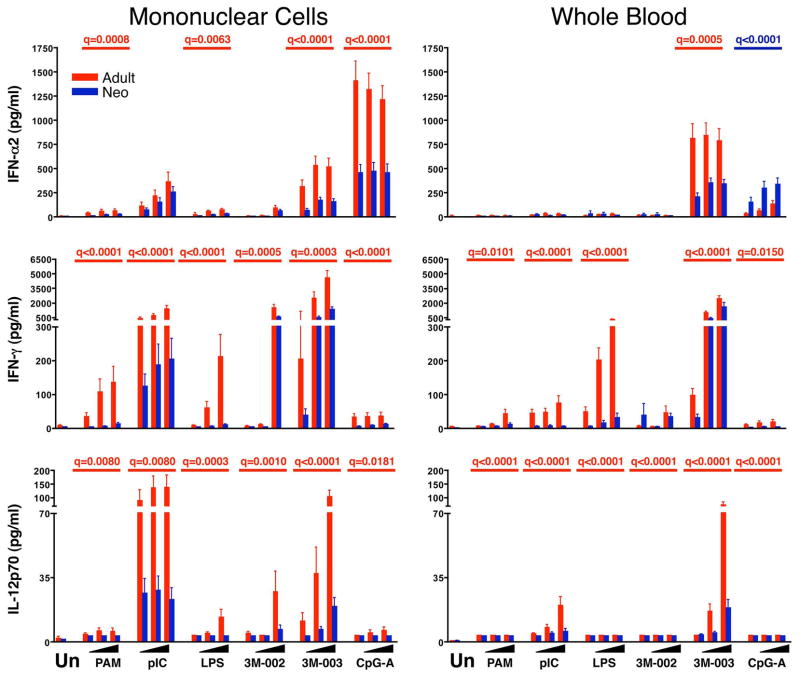
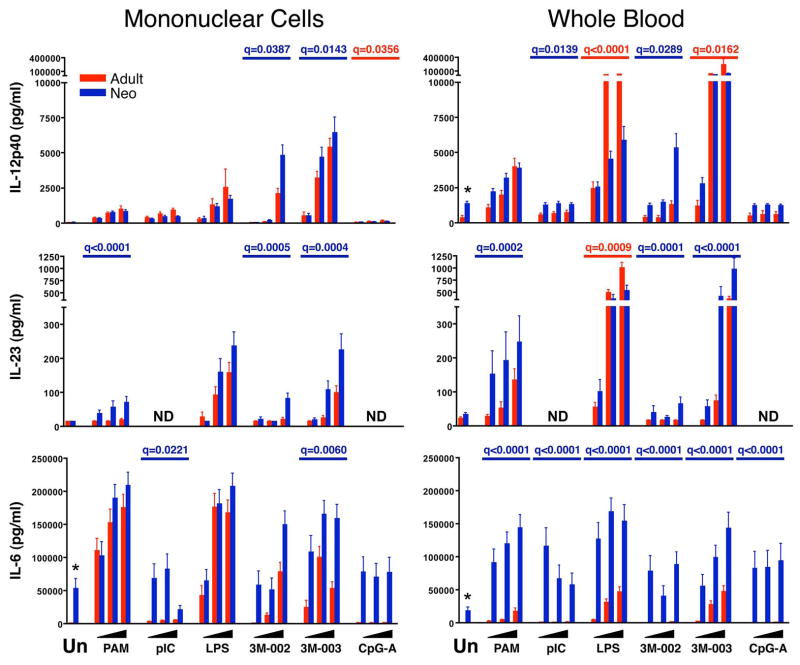
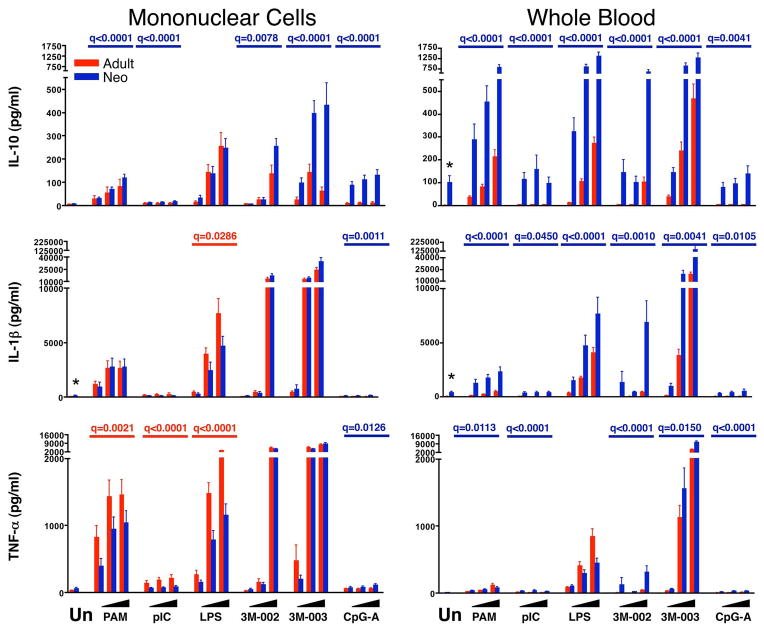
The human neonate and infant are unduly susceptible to infection with a wide variety of microbes. This susceptibility is thought to reflect differences from adults in innate and adaptive immunity, but the nature of these differences is incompletely characterized. The innate immune response directs the subsequent adaptive immune response after integrating information from TLRs and other environmental sensors. We set out to provide a comprehensive analysis defining differences in response to TLR ligation between human neonates and adults. In response to most TLR ligands, neonatal innate immune cells, including monocytes and conventional and plasmacytoid dendritic cells produced less IL-12p70 and IFN-alpha (and consequently induced less IFN-gamma), moderately less TNF-alpha, but as much or even more IL-1beta, IL-6, IL-23, and IL-10 than adult cells. At the single-cell level, neonatal innate cells generally were less capable of producing multiple cytokines simultaneously, i.e., were less polyfunctional. Overall, our data suggest a robust if not enhanced capacity of the neonate vs the adult white-blood cell TLR-mediated response to support Th17- and Th2-type immunity, which promotes defense against extracellular pathogens, but a reduced capacity to support Th1-type responses, which promote defense against intracellular pathogens.


Figures

Figure 1
Figure 1. Example of intracellular cytokine production by adult or neonatal monocytes in MC and WB samples
Shown are results for MC (left) and WB (right) from adult or neonatal monocytes. Samples were either unstimulated (red) or stimulated with TLR4 ligand LPS (100 ng/ml, blue) for 6 h in the presence of Brefeldin A, then expression of IL-6, IL-12/23p40, and TNF-α were determined by multiparameter flow cytometry. Note that we set quadrants for the analysis of a given cytokine expression so that unstimulated samples were <1% positive in ICC for every cytokine for both neonate and adult in both MC and WB.
Figure 2
Figure 2. Neonatal monocytes in WB are less responsive and less polyfunctional to TLR stimulation than adult WB monocytes, while there is little difference between monocytes in MC
MC or WB samples from 25 adults and 25 neonates were stimulated with the indicated TLR ligands (only results for the maximal concentration for each ligand are shown) for 6 hours, and expression of intracellular TNF-α, IL-6, and IL12/23p40 by monocytes was determined by multiparameter flow cytometry. A) Results (mean ± SD) are the percentage and the mean fluorescence intensity (MFI) of monocytes producing an individual cytokine or the total percentage of cells producing any cytokine, with the top and bottom panels showing monocytes in MC and WB, respectively. The probability that differences are significant after correction for multiple comparisons are shown as q-values (see statistical methods for description); blue and red are used to indicate values for which neonates and adults, respectively, were significantly different. B) Top- Stacked bar graphs in which the overall height of the bar indicates the total percentage of monocytes producing any cytokine and the height of each color (coded as shown in the insert) indicates the percentage of monocytes expressing an individual cytokine or cytokine combination. Bottom - ternary plots, in which each circle depicts the degree of polyfunctionality of cells from one adult (red circles) or neonate (blue circles). Circles closer to the left lower corner of the triangles are monocytes that expressed any one of the cytokines tested, circles closer to the right lower corner are monocytes that expressed any 2, and those closer to the top corner expressed all 3 (see methods for a more detailed description of ternary plots).
Figure 3
Figure 3. Neonatal cDCs are less responsive and less polyfunctional to TLR stimulation. The difference is more pronounced in WB as compared to MC
MC or WB samples from 25 adults and 25 neonates were stimulated with the indicated TLR ligands (only results for the maximal concentration for each ligand are shown) for 6 hours, and expression of intracellular TNF-α, IL-6, and IL12/23p40 by cDCs was determined by multiparameter flow cytometry. A) Results (mean ± SD) are the percentage and the mean fluorescence intensity (MFI) of cDCs producing an individual cytokine or the total percentage of cells producing any cytokine, with the top and bottom panels showing monocytes in MC and WB, respectively. B) Top - stacked bar graphs in which the overall height of the bar indicates the total percentage of cDCs producing any cytokine and the height for each color (coded as shown in the insert) indicates the percentage of cDC expressing an individual cytokine or cytokine combination. Bottom - ternary plots, in which each circle depicts the degree of polyfunctionality of cells from one adult (red circles) or neonate (blue circles). See Figure 2 legend for further details.
Figure 4
Figure 4. Neonatal pDCs are less responsive and less polyfunctional to TLR7/8 and TLR7 stimulation for both MC & WB
MC or WB samples from 25 adults and 25 neonates were stimulated with the indicated TLR ligands (only results for the maximal concentration for each ligand are shown) for 6 hours, and expression of intracellular TNF-α, IL-6, and IFN-α by pDCs was determined by multiparameter flow cytometry. A) Results (mean ± SD) are the percentage and the mean fluorescence intensity (MFI) of pDCs producing an individual cytokine or the total percentage of cells producing any cytokine, with the top and bottom panels showing pDC in MC and WB, respectively. B) Top - stacked bar graphs in which the overall height of the bar indicates the total percentage of pDCs producing any cytokine and the height for each color (coded as shown in the insert) indicates the percentage of pDC expressing an individual cytokine or cytokine combination. Bottom - ternary plots, in which each circle depicts the degree of polyfunctionality of cells from one adult (red circles) or neonate (blue circles). See Figure 2 legend for further details.
Figure 5
Figure 5. The degree of polyfunctionality may be a specifically regulated function for some but not all cytokines
MC or WB samples from 25 adults and 25 neonates were stimulated with the indicated TLR ligands (only results for the maximal concentration for each ligand are shown) for 6 hours, and expression of intracellular TNF-α, IL-6, and IL12/23p40 by monocytes was determined by multiparameter flow cytometry. The y-axis depicts the MFI (mean fluorescent intensity) for the indicated cytokine for monocytes that produced only the indicated cytokine (solid bar, monofunctional cells) or monocytes that produced the indicated cytokine plus any of the others (hatched bar, polyfunctional cells) with results for adults shown in red and neonates in blue.
Figure 6
Figure 6. Diminished production of type 1 cytokines by neonatal cells
Results are the mean ± SE concentrations of IFN-α2 (top), IFN-γ (middle), and IL-12p70 (bottom) in 18 hr culture supernatant for MC (left panels) or WB (right panels), comparing adult (red bars and q values) to neonatal (blue bars and q values) samples (n = 25 each). Cultures were stimulated with nothing (unstimulated, Un) or with increasing concentrations from left to right (indicated by the black triangles) of PAM3CSK4 (TLR2/6), pI:C (TLR3), LPS (TLR4), 3M-002 (TLR8), 3M-003 (TLR7/8), or CpGA (TLR9). The probability that differences are significant after correction for multiple comparisons is shown as q-values (see statistical methods for description) but only if there was a significant difference between neonatal and adult samples.
Figure 7
Figure 7. Relatively greater production of Th17-inducing cytokines by neonatal compared to adult cells
Results are the mean ± SE concentrations of IL-12p40 (top), IL-23 (middle), and IL-6 (bottom) in 18 hr culture supernatant for MC (left panels) or WB (right panels), comparing adult (red bars and q values) to neonatal (blue bars and q values) samples (n = 25 each). Cultures were stimulated with nothing (unstimulated, Un) or with increasing concentrations from left to right (indicated by the black triangles) of PAM3CSK4 (TLR2/6), pI:C (TLR3), LPS (TLR4), 3M-002 (TLR8), 3M-003 (TLR7/8), or CpGA (TLR9). The probability that differences are significant after correction for multiple comparisons is shown as q-values (see statistical methods for description) but only if there was a significant difference between neonatal and adult samples. ND = Not determined.
Figure 8
Figure 8. Neonatal WB makes more IL-10 as compared to adult
Results are the mean ± SE concentrations of TNF-α (top), IL-1β (middle), and IL-10 (bottom) in 18 hr culture supernatant for MC (left panels) or WB (right panels), comparing adult (red bars and q values) to neonatal (blue bars and q values) samples (n = 25 each). Cultures were stimulated with nothing (unstimulated, Un) or with increasing concentrations from left to right (indicated by the black triangles) of PAM3CSK4 (TLR2/6), pI:C (TLR3), LPS (TLR4), 3M-002 (TLR8), 3M-003 (TLR7/8), or CpGA (TLR9). The probability that differences are significant after correction for multiple comparisons is shown as q-values (see statistical methods for description) but only if there was a significant difference between neonatal and adult samples.

References

    1. Klein JO, Baker CJ, Remington JS, Wilson CB. Current Concepts of Infections of the Fetus and Newborn Infant. In: Klein JO, Remington JS, Wilson CB, Baker CJ, editors. Infectious Diseases of the Fetus and Newborn Infant. 6. Elsevier Saunders; Philiadelphia: 2006. pp. 1–24.
    1. Lewis DB, Wilson CB. Developmental Immunology and Role of Host Defenses in Fetal and Neonatal Susceptibility to Infection. In: Remington Jack JOKS, Wilson Christopher B, Baker Carol J., editors. Infectious Diseases of the Fetus and Newborn Infant. 6. Elsevier Saunders; Philiadelphia: 2006. pp. 25–138.
    1. Levy O. Innate immunity of the newborn: basic mechanisms and clinical correlates. Nat Rev Immunol. 2007;7:379–390. - PubMed
    1. Willems F, Vollstedt S, Suter M. Phenotype and function of neonatal DC. Eur J Immunol. 2009;39:26–35. - PubMed
    1. Joyner JL, Augustine NH, Taylor KA, La Pine TR, Hill HR. Effects of group B streptococci on cord and adult mononuclear cell interleukin-12 and interferon-gamma mRNA accumulation and protein secretion. J Infect Dis. 2000;182:974–977. - PubMed

Publication types