. 2009 Dec 1;183(11):7314-25.
doi: 10.4049/jimmunol.0902452. Epub 2009 Nov 16.

Taking advantage: high-affinity B cells in the germinal center have lower death rates, but similar rates of division, compared to low-affinity cells

Affiliations

Taking advantage: high-affinity B cells in the germinal center have lower death rates, but similar rates of division, compared to low-affinity cells

Shannon M Anderson et al. J Immunol. .

Abstract

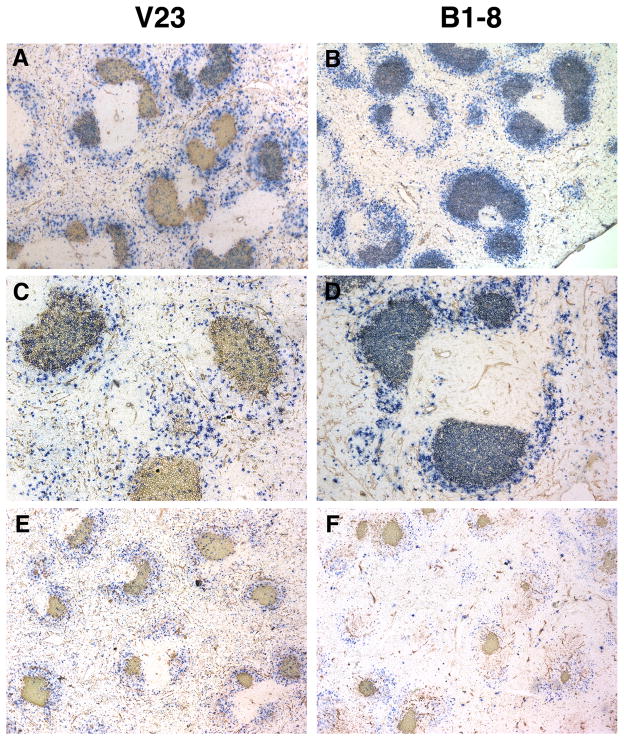
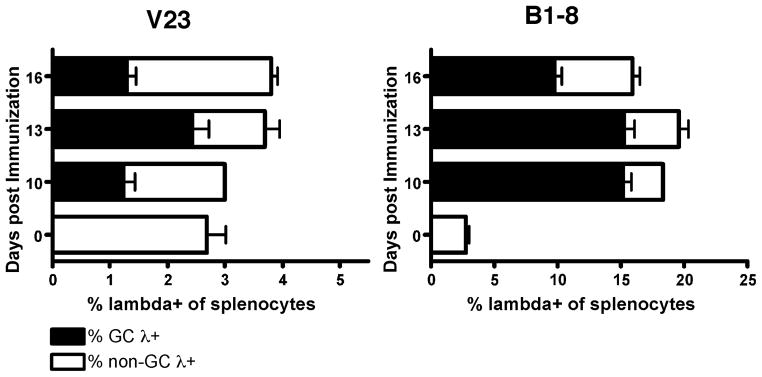
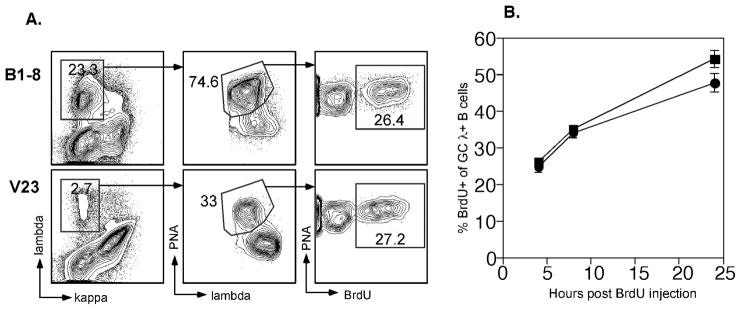
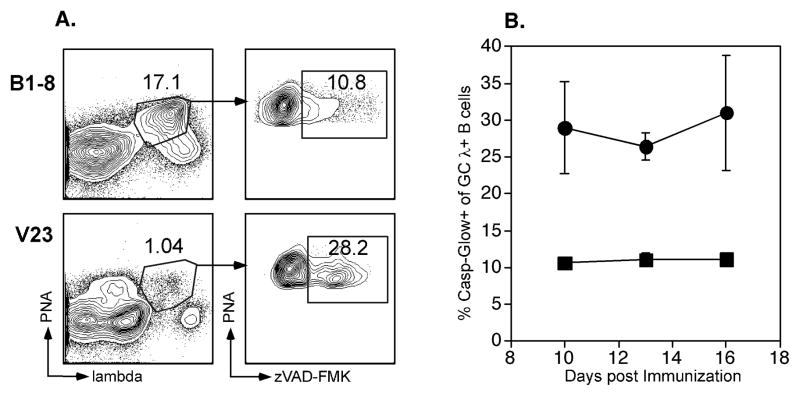
B lymphocytes producing high-affinity Abs are critical for protection from extracellular pathogens, such as bacteria and parasites. The process by which high-affinity B cells are selected during the immune response has never been elucidated. Although it has been shown that high-affinity cells directly outcompete low-affinity cells in the germinal center (GC), whether there are also intrinsic differences between these cells has not been addressed. It could be that higher affinity cells proliferate more rapidly or are more likely to enter cell cycle, thereby outgrowing lower affinity cells. Alternatively, higher affinity cells could be relatively more resistant to cell death in the GC. By comparing high- and low-affinity B cells for the same Ag, we show here that low-affinity cells have an intrinsically higher death rate than do cells of higher affinity, even in the absence of competition. This suggests that selection in the GC reaction is due at least in part to the control of survival of higher affinity B cells and not by a proliferative advantage conferred upon these cells compared with lower affinity B cells. Control over survival rather than proliferation of low- and high-affinity B cells in the GC allows greater diversity not only in the primary response but also in the memory response.


Figures

Figure 1
Figure 1. GCs in V23 mice contain fewer antigen-specific, λ+ B cells than GCs in B1-8 mice
Immunohistological analysis of splenic sections from V23 and B1-8 mice immunized with NP-CGG 16 days before. Anti- λ (blue) identifies antigen-specific B cells and PNA (red) identifies GC B cells. (A and B, 40x magnification) (C and D) Higher power magnification (100x). (C) The composition of GCs in immunized V23 mice is a mixture of both λ+ and κ+ B cells. (E and F, 40x magnification) GCs are present in alum immunized mice, but there are very few λ+ B cells in these GCs.
Figure 2
Figure 2. Decreased frequency of λ+ GC B cells in V23 mice compared to B1-8 mice
The frequency of live spleen cells that are λ+PNA+ or λ+PNA− as determined by FACS is shown. Numbers of spleen cells that are λ+PNA+ and PNA− correlate with the frequencies in the spleen (data not shown). Error bars represent SEM and n=8–16 mice per strain from at least 3 independent experiments for each day. All differences between V23 and B1-8 mice, p < 10−6.
Figure 3
Figure 3. V23 λ+ GC B cells proliferate to at least the same extent as B1-8 GC B cells
Mice were injected with BrdU 13 days post immunization and sacrificed at the indicated time points post injection. (A) Detection of BrdU-labeled GC B cells in V23 and B1-8 mice 4 hours post-injection. BrdU+ cells (third column) were gated from the PNA+λ+ cells (second column) that were originally gated on live λ+/κ − spleen cells (first column). (B) Summary of the percentage of BrdU+ cells among PNA+ λ+ cells in V23 (λ) and B1-8 (ν) spleens. Error bars represent SEM and n=6–9 mice per strain for each time point from at least 2 experiments. The differences between the two groups were not significant (p=0.47 and 0.64 for 4 and 8 hrs, but approached significance at 24 hrs (p=0.08) as assessed by two-tailed Student’s t test.
Figure 4
Figure 4. There is a higher frequency of V23 GC B cells undergoing apoptosis than B1-8 GC B cells
(A) Representative flow cytometric profiles of spleen cells stained with PNA, λ, and zVAD-FMK-FITC. (B) The percentage of zVAD-FMK binding cells of the PNA+ λ+ population was determined at 10, 13 and 16 days post immunization in V23 (λ) and B1-8 (ν) mice. Error bars represent SEM from n=3 mice at days 10 and 16 and n>=18 mice per strain at day 13. Day 13 data were compiled from 5 individual experiments. V23 and B1-8 mice were significantly different overall (p < 10−9). P-values for individual days were: day 10: 0.03; day 13: 8.5 × 10⁻⁸; day 16: 0.06.
Figure 5
Figure 5. VJ junctions differ dramatically between V23 and B1-8 mice
Plotted is the number of B cell lineages that have specific junctions at day 10 (projecting upwards) and at day 16 (projecting downwards) in (A) V23 and (B) B1-8 mice.
Figure 6
Figure 6. Distribution of nucleotide substitions in V23 and B1-8 sequences recovered from GCs and days 10 and 16
The number of B cell lineages in (A) V-23 and (C) B1-8 mice that have specific nucleotide mutations at days 10 (projecting upwards) and 16 (projecting downwards). The colors indicate distribution of these mutations amongst terminal (red/dark) and non-terminal (yellow/light). Statistical significance of mutation enrichment at the non-terminal branch is indicated by an asterisk (p < 0.05). Double asterisk (q < 0.05) reflects significance after correction for multiple testing. (B) shows the relative mutability scores (37) at each mutated position in (A) and (C). Regions corresponding to CDRs are indicated by the “C”. The black dotted lines indicate the average mutability in the different CDRs and FWRs.
Figure 7
Figure 7. Effects of recurrent Vλ1 mutations on NP-binding
The indicated mutations were made in Vλ1 by site-directed mutagenesis and proteins expressed in combination with the V23 H chain expressed as an IgG1 (see Materials and Methods). Germline Vλ1 was expressed with either V23 or B1-8 H chains also as IgG1 for comparison. These were tested for binding to NP20-CGG by ELISA. OD405 is shown with points being averages of duplicates for each concentration on a single plate. (A) Comparison of various Vλ1 mutants and the germline in combination with V23. (B) Comparison of the germline Vλ1 in context of B1-8 or V23 with the best of the Vλ1 mutants in context of V23.
Figure 8
Figure 8. Mathematical modeling of GC cell turnover
(A) Depiction of model scheme and parameters. Estimated parameter values are shown in parenthesis (B1-8, V23), as are the steady-state relative population sizes for each of the compartments. As discussed in the text, this basic model assumes that inflow and outflow of cells from the GC is negligible at day 13. (B) Optimal fit of the model to the experimental BrdU and Casp-Glow labeling data reproduces well the observed BrdU staining (as well as the apoptotic fraction, 13% for B1-8 and 26% for V23 GC B cells at day 13 (see Supplementary Table 2 for parameter values). The optimization minimizes a sum of squares error function where the two sources of data (i.e., BrdU and Casp-Glow labeling) are weighted equally. Red squares are the B1-8 experimental data, while blue circles are the V23 experimental data (from Figure 4). The total population size was constrained to be constant (i.e., the population is at steady-state).
Figure 9
Figure 9. CD86 and CD23 are expressed at lower levels on BrdU+ GC B cells as compared to BrdU-negative GC cells
Mice were injected with BrdU 13 days post immunization and sacrificed 8 hours later. (A) Levels of CD86 (top row) and CD23 (bottom row) were compared between BrdU+ (black lines) and BrdU-negative (shaded histograms) GC B cells from V23 (left column) and B1-8 (right column) mice. Data is representative of 7–9 mice from 3 independent experiments. (B) Summary of the Mean Fluorescence Intensity (MFI) of CD86 expression on BrdU+ and BrdU-negative GC B cells. Results are shown for both the V23 and B1-8 strains from a representative experiment out of 2 independent replicates. Each symbol is an independent mouse from that experiment and the bar is the mean value.

References

    1. Chua MM, Goodgal SH, Karush F. Germ-line affinity and germ-line variable-region genes in the B cell response. J Immunol. 1987;138:1281–1288. - PubMed
    1. Clarke SH, Staudt LM, Kavaler J, Schwartz D, Gerhard WU, Weigert MG. V region gene usage and somatic mutation in the primary and secondary responses to influenza virus hemagglutinin. Journal of Immunology. 1990;144:2795–2801. - PubMed
    1. Dal Porto JM, Haberman AM, Shlomchik MJ, Kelsoe G. Antigen drives very low affinity B cells to become plasmacytes and enter germinal centers. J Immunol. 1998;161:5373–5381. - PubMed
    1. Eisen HN, Siskind GW. Variations in Affinities of Antibodies During the Immune Response. Biochemistry. 1964;155:996–1008. - PubMed
    1. Jacob J, Przylepa J, Miller C, Kelsoe G. In situ studies of the primary immune response to (4-hydroxy-3-nitrophenyl)acetyl. III. The kinetics of V region mutation and selection in germinal center B cells. Journal of Experimental Medicine. 1993;178:1293–1307. - PMC - PubMed

Publication types