. 2010 Jan;30(2):481-95.
doi: 10.1128/MCB.00688-09. Epub 2009 Nov 16.

A role for p38 stress-activated protein kinase in regulation of cell growth via TORC1

Affiliations

A role for p38 stress-activated protein kinase in regulation of cell growth via TORC1

Megan Cully et al. Mol Cell Biol. 2010 Jan.

Abstract

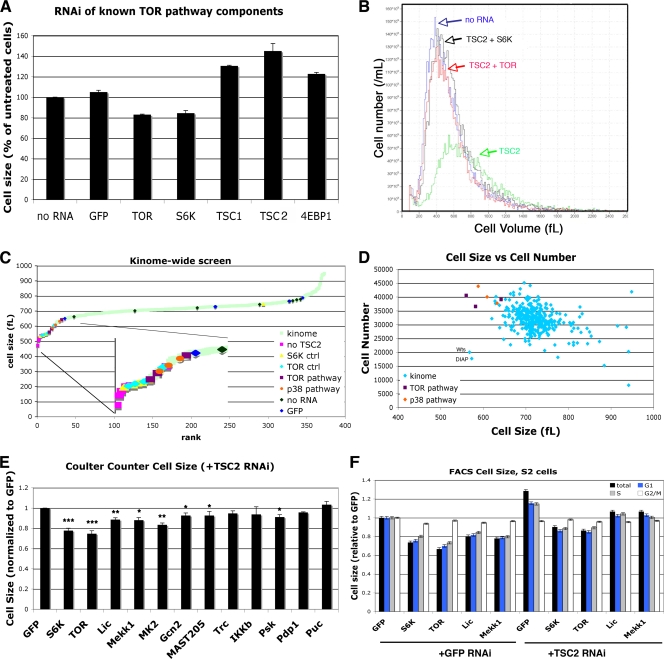
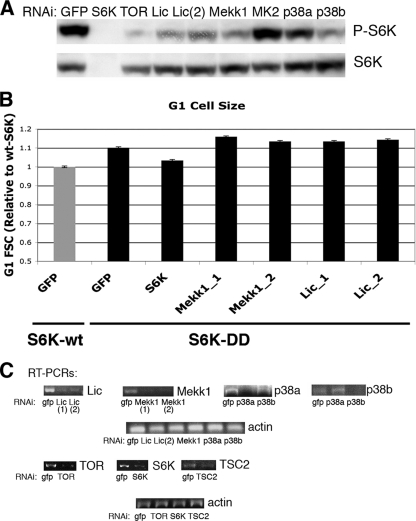
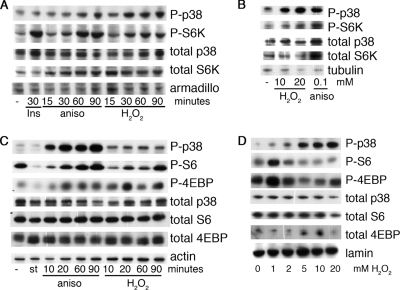
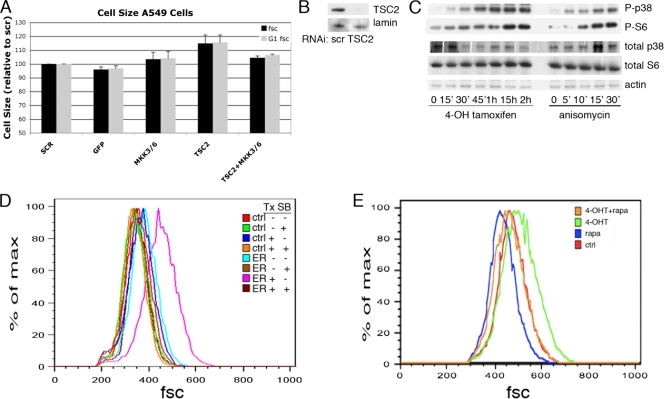
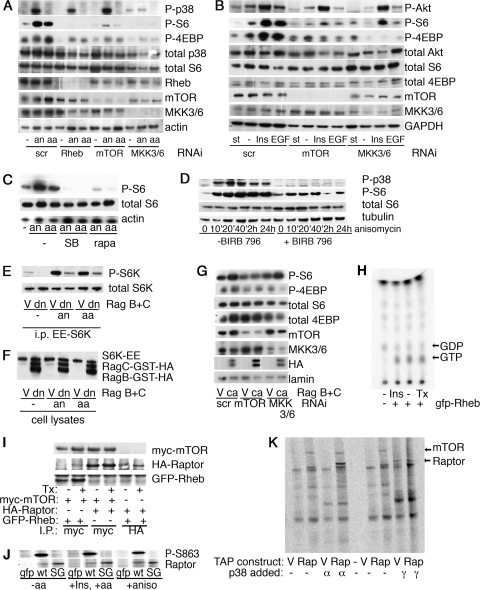
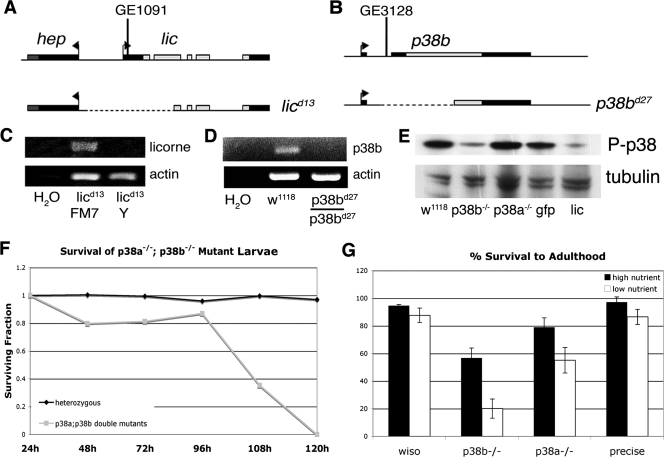
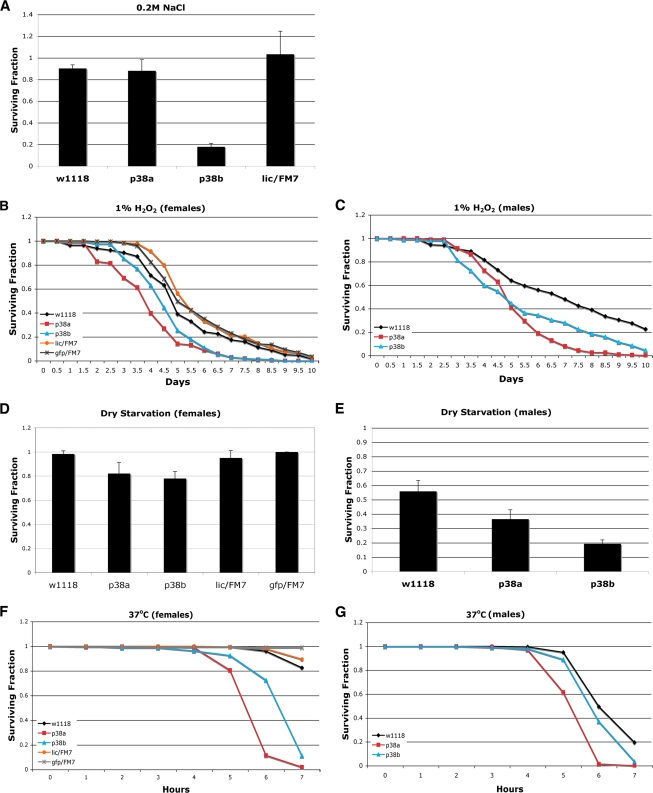
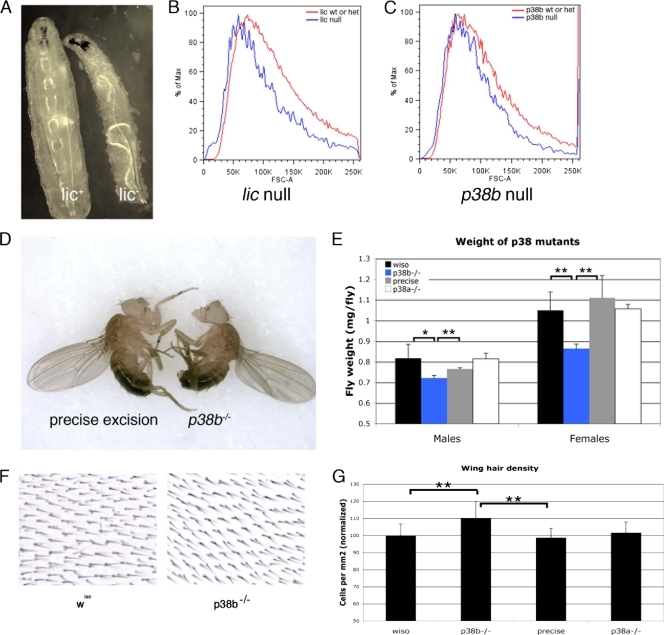
The target of rapamycin (TOR) complex 1 (TORC1) signaling pathway is a critical regulator of translation and cell growth. To identify novel components of this pathway, we performed a kinome-wide RNA interference (RNAi) screen in Drosophila melanogaster S2 cells. RNAi targeting components of the p38 stress-activated kinase cascade prevented the cell size increase elicited by depletion of the TOR negative regulator TSC2. In mammalian and Drosophila tissue culture, as well as in Drosophila ovaries ex vivo, p38-activating stresses, such as H(2)O(2) and anisomycin, were able to activate TORC1. This stress-induced TORC1 activation could be blocked by RNAi against mitogen-activated protein kinase kinase 3 and 6 (MKK3/6) or by the overexpression of dominant negative Rags. Interestingly, p38 was also required for the activation of TORC1 in response to amino acids and growth factors. Genetic ablation either of p38b or licorne, its upstream kinase, resulted in small flies consisting of small cells. Mutants with mutations in licorne or p38b are nutrition sensitive; low-nutrient food accentuates the small-organism phenotypes, as well as the partial lethality of the p38b null allele. These data suggest that p38 is an important positive regulator of TORC1 in both mammalian and Drosophila systems in response to certain stresses and growth factors.


Figures

FIG. 1.
FIG. 1.
A genetic screen for regulators of TSC2-mediated cell size identifies members of the p38 pathway. (A) RNAi targeting known members of the Tor pathway in Drosophila S2 cells. S2 cells were treated with the indicated RNAi for 5 days, and cell size was measured by Coulter counter. Error bars represent standard errors of the means (SEMs) across 3 independent experiments. (B) RNAi targeting either S6K or TOR can rescue the large-cell phenotype caused by RNAi targeting TSC2. Cells were treated with both RNAis together for 5 days. Cell size was measured using a Coulter counter. (C, D) S2 cells were treated with TSC2 RNAi together with RNAi molecules targeting each Drosophila kinase or phosphatase. “TOR ctrl,” “S6K ctrl,” and “GFP” indicate RNAi molecules that were synthesized independently from the rest of the RNAi collection. “TOR pathway” and “p38 pathway” indicate RNAi molecules targeting components of these two pathways within the screened RNAi collection. (C) Each RNAi in the screen is presented in order of increasing cell size. (D) Components of the p38 pathway affect both cell size and cell number. RNAi molecules targeting components of either the TOR or the p38 pathway result in increased cell number and decreased cell size. Data points in panels C and D are averages of two independent repeats. (E) A second, nonoverlapping RNAi was used to validate 10 RNAi molecules identified in the screen. As in the initial screen, S2 cells were treated with the indicated RNAi for 5 days, either alone or with TSC2 RNAi. Error bars represent SEMs across 3 independent experiments. (F) Cells were treated with RNAi as indicated, together with either TSC2 or GFP RNAi. Cells were harvested, stained with propidium iodide, and analyzed by flow cytometry. All populations were normalized to the results for GFP RNAi, set to 1, to allow for comparisons between experiments. The forward scatter of the total population, as well as of the G1-, S-, and G2/M-gated populations, are shown. Error bars represent the SEMs within one representative experiment. ***, P < 0.005; **, P < 0.01; *, P < 0.05.
FIG. 2.
FIG. 2.
Licorne RNAi prevents the cell size increase mediated by Tsc2 RNAi but does not affect the size of cells overexpressing S6K-DD. (A) S2 cells were treated with Tsc2 RNAi plus the indicated RNAi. Total cell extracts were immunoblotted with the indicated antibodies. (B) S2 cells were stably transfected with either wild-type S6K (S6K-wt) or with a mutated form of S6K in which both T238 and T398 were mutated to aspartate (S6K-DD). Pools of stably transfected cells were treated with RNAi as indicated, stained with propidium iodide, and analyzed by flow cytometry. The forward scatter (FSC) for the G1-gated population is shown. Error bars represent the SEMs from a representative experiment. (C) Semiquantitative RT-PCR was used to measure the indicated mRNA species in S2 cells treated with RNAi for 5 days.
FIG. 3.
FIG. 3.
Stimulus and dose-specific activation of p38 induces phosphorylation of Tor targets. (A) S2 cells were treated with 1 μM insulin (Ins), 10 μg/ml anisomycin (aniso), or 1 mM H2O2 as indicated. Cell extracts were collected and analyzed by immunoblotting. (B) Ovaries from wiso females were dissected into PBS and stimulated for 1 h at room temperature as indicated. The ovaries were lysed in protein sample buffer, sonicated, and analyzed by immunoblotting. (C) A549 cells were starved of serum overnight and then starved of amino acids for 90 min (st), treated with 10 μg/ml anisomycin (aniso) or 1 mM H2O2 for the indicated times, and analyzed by immunoblotting. −, cells were grown in 10% serum. (D) Induction of S6 phosphorylation by H2O2 is dose dependent. A549 cells were treated for 30 min with the indicated concentrations of H2O2 and analyzed by immunoblotting.
FIG. 4.
FIG. 4.
Activation and inhibition of the p38 pathway alter cell size. (A) A549 cells were treated with the indicated RNAi for 3 days, stained with propidium iodide, and analyzed by flow cytometry. The forward scatter (fsc) of the total population, as well as of the G1-gated population, is shown. Error bars represent SEMs of this representative experiment. (B) Western blot analysis indicating the amount of TSC2 protein remaining following a three-day treatment with TSC2 siRNA. (C) Phosphorylation of p38 and S6 is induced by 4-hydroxytamoxifen treatment of 293 cells stably transfected with MEKK3-ER. 293 cells stably expressing MEKK3-ER were treated with 100 nM 4-hydroxytamoxifen or 10 μg/ml of anisomycin for the indicated amount of time (′, minutes). Total cell lysates were analyzed by immunoblotting with the indicated antibodies. (D, E) Long-term activation of MEKK3-ER by 4-hydroxytamoxifen (4-OHT) treatment increases cell size. (D) Control 293 cells (ctrl) or 293 cells stably expressing MEKK3-ER (ER) were treated with 4-hydroxytamoxifen (Tx) and/or SB202190 (SB) for 24 h as indicated, stained with propidium iodide, and analyzed by flow cytometry. The results for the G1-gated population are shown. (E) 293 cells stably expressing MEKK3-ER were treated with 4-hydroxytamoxifen and/or rapamycin (rapa) as indicated, stained, and analyzed as described for panel D. scr, scrambled siRNA control.
FIG. 5.
FIG. 5.
Amino acid and insulin stimulation of S6 is blocked by p38 pathway inhibition. (A) RNAi against MKK3 and MKK6 can prevent the amino acid-induced phosphorylation of S6 in A549 cells. Cells were treated with the indicated RNAi for two days before being placed in serum-free medium overnight. The cells were then further starved of amino acids for 90 min before being stimulated with either amino acids or 10 μg/ml anisomycin for 20 min. Cells were lysed and analyzed by immunoblotting. “scr” indicates a scrambled RNAi that should not target any known protein. (B) RNAi against MKK3 and MKK6 can prevent the phosphorylation of S6 in response to insulin and EGF in A549 cells. Cells were treated with the indicated RNAi for 48 h, starved overnight of serum (st), and then stimulated for 20 min with 1 μM insulin (Ins) or 100 nM EGF. −, cells were grown in 10% serum without stimulation; P-Akt, Akt phosphorylated on S473; GAPDH, glyceraldehyde-3-phosphate dehydrogenase. (C) The p38 inhibitor SB202190 can prevent the phosphorylation of S6 in response to anisomycin or amino acids in A549 cells. A549 cells were starved as described for panel A. Rapamycin (rapa) or SB202190 (SB) was added 1 h before the stimulation with either amino acids or anisomycin as indicated. (D) Time course of BIRB 796 treatment. A549 cells were treated with 10 μM BIRB 796 or DMSO control for 1 h before being treated with 10 μg/ml anisomycin for the indicated time. (E) Overexpression of dominant negative Rags can prevent the phosphorylation of S6K in response to either anisomycin or amino acids. Dominant negative forms of RagB and RagC were cotransfected into 293 cells along with S6K-EE. Cells were starved and stimulated as described for panel A. S6K was immunoprecipitated using antibodies against the EE tag. Levels of phosphorylated S6K and total S6K present in the immunoprecipitates were determined by Western blotting. (F) Expression levels of overexpressed proteins from total cell lysates used in the experiments whose results are shown in panel E were determined by Western blotting. (G) Constitutively active Rags can induce phosphorylation of TORC1 targets even in the presence of RNAi against MKK3/6. 293 cells were treated with the indicated RNAis and transfected with the indicated Rag constructs. Cells were starved of serum overnight, lysed, and analyzed by immunoblotting. (H) GTP loading of Rheb. 293 cells stably expressing MEKK3-ER were transfected with either empty vector or GFP-Rheb as indicated. Following starvation, cells were stimulated with either 1 μM insulin (Ins) for 30 min or 100 nM 4-hydroxytamoxifen (Tx) for 4 h. The amounts of 32P-radiolabeled GTP and GDP coimmunoprecipitating with GFP-Rheb are indicated. (I) Coimmunoprecipitation between Rheb, mTOR, and Raptor. 293 cells stably expressing MEKK3-ER were transfected as indicated. Immunoprecipitates were analyzed by Western blotting. (J) Phosphorylation of Raptor S863 is not dynamically regulated. HeLa cells were transfected with vectors expressing GFP alone, wild-type HA-Raptor (wt), or S863G HA-Raptor (SG). Cells were starved of serum overnight and then starved of amino acids as indicated. Stimulation with insulin (Ins), anisomycin (an), or amino acids (aa) was performed for 20 min before cells were lysed. Immunoprecipitation was performed with anti-HA antibodies, and immunoprecipitates were analyzed by Western blotting. (K) 293 cells stably transfected with either empty vector (V) or TAP-tagged Raptor (Rap) were lysed, and tandem affinity tag purification was performed. These purified complexes were then incubated with purified, recombinant p38α or p38γ along with [33P]ATP. The proteins were separated by sodium dodecyl sulfate-polyacrylamide gel electrophoresis and visualized by phosphorimager. aa, amino acids; an, anisomycin; V, empty vector; dn, dominant negative Rag; i.p. or I.P., immunoprecipitates.
FIG. 6.
FIG. 6.
Genetic disruption of licorne and p38b. (A, B) Schematic diagrams showing the genomic regions surrounding licorne (A) and p38b (B). Imprecise excisions from these loci generated null alleles, licd13 and p38bd27, diagrammed below. (C, D) RT-PCR results from larvae of the indicated genotype. (E) Western blot analysis of phospho-p38 levels in larvae of the indicated genotypes harvested 72 h after egg lay. (F) Survival of larvae null for both p38a and p38b. Larvae were counted every 24 h. (G) Fraction of larvae of the indicated genotypes that survived to adulthood. L1 larvae were collected 24 h after egg lay and transferred in groups of 50 to vials containing either high-nutrient or low-nutrient food. The total number of adults eclosing from each vial in the subsequent 14 days were counted. Error bars indicate standard deviations. wiso, wiso; precise, precise excision.
FIG. 7.
FIG. 7.
p38b and lic mutants are sensitive to certain stresses. (A) p38bd27 larvae are sensitive to high salt. Larvae of the indicated genotypes were collected 24 h after egg lay and placed on normal food supplemented with 0.2 M NaCl. Surviving adults were counted 12 days later. Error bars indicate standard deviations; n = 225 per genotype. (B, C) p38bd27 adult flies are sensitive to H2O2. Two- to five-day-old females (B) and males (C) of the indicated genotypes were placed in vials containing normal food supplemented with 1% H2O2. Surviving flies were counted every 12 h. n = 200 per genotype. (D, E) p38bd27 and licd13/FM7 adult flies are sensitive to dry starvation. Two- to five-day-old females (D) and males (E) of the indicated genotypes were placed in empty vials. Surviving flies were counted 24 h and 36 h later. Error bars indicate standard deviations; n = 200 to 250 per genotype. (F, G) p38bd27 adult flies are sensitive to high temperatures. Two- to five-day-old females (F) and males (G) of the indicated genotypes were placed in vials containing wet paper towel and placed at 37°C. Surviving flies were counted every 30 min. n = 200 per genotype.
FIG. 8.
FIG. 8.
Genetic disruption of licorne or p38b decreases cell and organism size. (A) Phenotype of licd13 larvae from density-controlled vials 72 h after egg lay. (B, C) Results of flow cytometry analysis of wings discs containing lic null cells (B) and of wing discs containing cells null for both p38a and p38b (C). wt, wild type; het, heterozygous. (D, E) Phenotype of p38bd24/p38bd24 adults. Flies with the indicated genotypes were raised in low-nutrient food at a density of 50 larvae per vial. Adult flies were weighed in groups of 20. Error bars represent the standard deviations; n > 150 per genotype. *, P value of < 0.005 by Student's t test; **, P value of < 0.001 by Student's t test. (F, G) Hair densities on wings from adult flies raised on low-nutrient food. (F) High magnification of a region posterior to the L5 vein of wings with the indicated genotypes. (G) Quantification of the hair densities shown in panel F. The number of hairs in a defined area posterior to L5 was counted. Error bars represent the standard deviations; n = 20. **, P value of < 0.001 by Student's t test; wiso, wiso. Full genotypes are as follows. Panels A to C: licd13/FM7,Kr-GFP and licd13/Y (A); FRT19A,licd13/FRT19A,Ub-GFP; hsp70-FLP (B); hsp70-FLP; FRT40A,p38bd27/FRT40A,GFP; and p38a1/p38a1 (C). Panels D to G: precise excision, p38bd27/p38bd27; p38b, p38bd24/p38bd24; p38a, p38a1/p38a1.

References

    1. Ashwell, J. D. 2006. The many paths to p38 mitogen-activated protein kinase activation in the immune system. Nat. Rev. Immunol. 6:532-540. - PubMed
    1. Banerjee, S., K. Narayanan, T. Mizutani, and S. Makino. 2002. Murine coronavirus replication-induced p38 mitogen-activated protein kinase activation promotes interleukin-6 production and virus replication in cultured cells. J. Virol. 76:5937-5948. - PMC - PubMed
    1. Beugnet, A., A. R. Tee, P. M. Taylor, and C. G. Proud. 2003. Regulation of targets of mTOR (mammalian target of rapamycin) signalling by intracellular amino acid availability. Biochem. J. 372:555-566. - PMC - PubMed
    1. Bilanges, B., R. Argonza-Barrett, M. Kolesnichenko, C. Skinner, M. Nair, M. Chen, and D. Stokoe. 2007. Tuberous sclerosis complex proteins 1 and 2 control serum-dependent translation in a TOP-dependent and -independent manner. Mol. Cell. Biol. 27:5746-5764. - PMC - PubMed
    1. Biondi, R. M., A. Kieloch, R. A. Currie, M. Deak, and D. R. Alessi. 2001. The PIF-binding pocket in PDK1 is essential for activation of S6K and SGK, but not PKB. EMBO J. 20:4380-4390. - PMC - PubMed

Publication types

MeSH terms

LinkOut - more resources