. 2010 Feb;184(2):363-79.
doi: 10.1534/genetics.109.110528. Epub 2009 Nov 16.

Estimating divergence parameters with small samples from a large number of loci

Affiliations

Estimating divergence parameters with small samples from a large number of loci

Yong Wang et al. Genetics. 2010 Feb.

Abstract

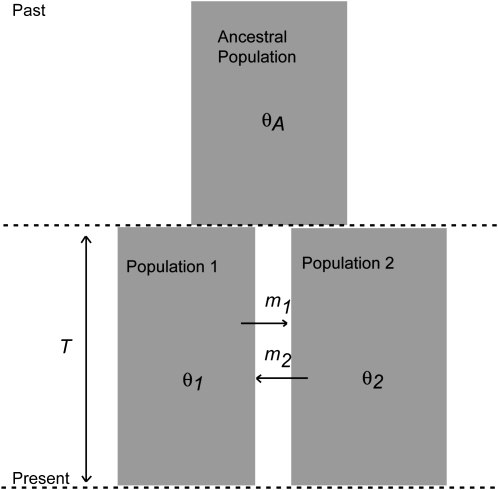
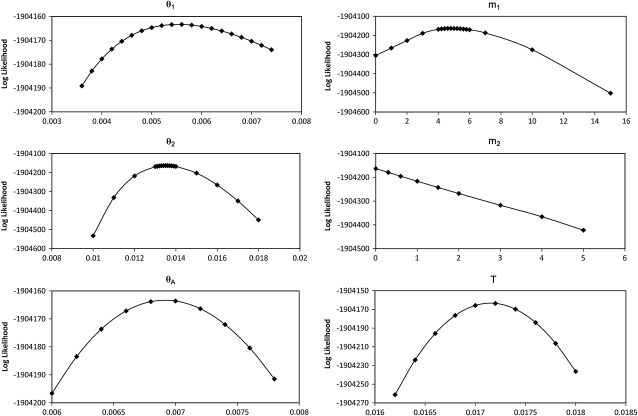
Most methods for studying divergence with gene flow rely upon data from many individuals at few loci. Such data can be useful for inferring recent population history but they are unlikely to contain sufficient information about older events. However, the growing availability of genome sequences suggests a different kind of sampling scheme, one that may be more suited to studying relatively ancient divergence. Data sets extracted from whole-genome alignments may represent very few individuals but contain a very large number of loci. To take advantage of such data we developed a new maximum-likelihood method for genomic data under the isolation-with-migration model. Unlike many coalescent-based likelihood methods, our method does not rely on Monte Carlo sampling of genealogies, but rather provides a precise calculation of the likelihood by numerical integration over all genealogies. We demonstrate that the method works well on simulated data sets. We also consider two models for accommodating mutation rate variation among loci and find that the model that treats mutation rates as random variables leads to better estimates. We applied the method to the divergence of Drosophila melanogaster and D. simulans and detected a low, but statistically significant, signal of gene flow from D. simulans to D. melanogaster.


Figures

F<sc>igure</sc> 1.—
Figure 1.—
The isolation-with-migration model. The demographic parameters are effective population sizes (θ1, θ2, and θA), gene migration rates (m1 and m2), and population splitting time (T).
F<sc>igure</sc> 2.—
Figure 2.—
Graphic representation of the three possible states for two sampled genes before coalescence. A migration event will result in a switch from one state to another.
F<sc>igure</sc> 3.—
Figure 3.—
Maximum-likelihood estimates of population parameters. Symbols in the graph represent the mean maximum-likelihood estimates and bars represent the corresponding standard deviations. I–IX stand for the nine combinations of sample sizes as described in Table 1. Panels (A–C) The result from data sets simulated with nonzero migration. (D–F) The result from data sets simulated without migration.
F<sc>igure</sc> 4.—
Figure 4.—
Profile-likelihood curves for population parameters. (A–C) The result from a data set simulated with nonzero migration. (D–F) The result from a data set simulated without migration.
F<sc>igure</sc> 5.—
Figure 5.—
Maximum-likelihood estimates of population parameters. Data are simulated with mutation rates sampled from a Gamma(15, 15) distribution and analyzed using different mutation scalar methods. Symbols in the graph represent the mean maximum-likelihood estimates and bars represent the corresponding standard deviations. I–VI stand for the six different mutation scalar methods as described in Table 4. (A–C) The result from data sets simulated with nonzero migration. (D–F) The result from data sets simulated without migration.
F<sc>igure</sc> 6.—
Figure 6.—
Profile-likelihood curves for population parameters. Data are simulated with mutation rate variation and analyzed using a all-rate model with a Gamma(15, 15) prior. (A–C) The result from a data set simulated with nonzero migration. (D–F) The result from a data set simulated without migration.
F<sc>igure</sc> 7.—
Figure 7.—
Profile-likelihood curves for the gamma parameter of the mutation scalar prior. (A) The curve from a data set simulated with nonzero migration. (B) The curve from a data set simulated without migration.
F<sc>igure</sc> 8.—
Figure 8.—
Distribution curves of divergence. (Top) Solid line, dashed line, and dashed-dotted line represent distribution of melanogaster–melanogaster, simulans–simulans, and melanogaster–simulans divergence, respectively. (Bottom) Solid line and dashed line represent distribution of melanogaster–yakuba and simulans–yakuba divergence, respectively.
F<sc>igure</sc> 9.—
Figure 9.—
Profile-likelihood curve for population parameters estimated from melanogaster–simulans–yakuba genome alignment.

Comment in

Similar articles

Cited by

References

    1. Becquet, C., and M. Przeworski, 2007. A new approach to estimate parameters of speciation models with application to apes. Genome Res. 17 1505–1519. - PMC - PubMed
    1. Beerli, P., and J. Felsenstein, 1999. Maximum-likelihood estimation of migration rates and effective population numbers in two populations using a coalescent approach. Genetics 152 763–773. - PMC - PubMed
    1. Beerli, P., and J. Felsenstein, 2001. Maximum likelihood estimation of a migration matrix and effective population sizes in n subpopulations by using a coalescent approach. Proc. Natl. Acad. Sci. USA 98 4563–4568. - PMC - PubMed
    1. Begun, D. J., A. K. Holloway, K. Stevens, L. W. Hillier, Y. P. Poh et al., 2007. Population genomics: whole-genome analysis of polymorphism and divergence in Drosophila simulans. PLoS Biol. 5 e310. - PMC - PubMed
    1. Burgess, R., and Z. Yang, 2008. Estimation of hominoid ancestral population sizes under Bayesian coalescent models incorporating mutation rate variation and sequencing errors. Mol. Biol. Evol. 25 1979–1994. - PubMed

Publication types

LinkOut - more resources