. 2009 Nov 23;206(12):2593-601.
doi: 10.1084/jem.20091472. Epub 2009 Nov 16.

Induced bronchus-associated lymphoid tissue serves as a general priming site for T cells and is maintained by dendritic cells

Affiliations

Induced bronchus-associated lymphoid tissue serves as a general priming site for T cells and is maintained by dendritic cells

Stephan Halle et al. J Exp Med. .

Abstract

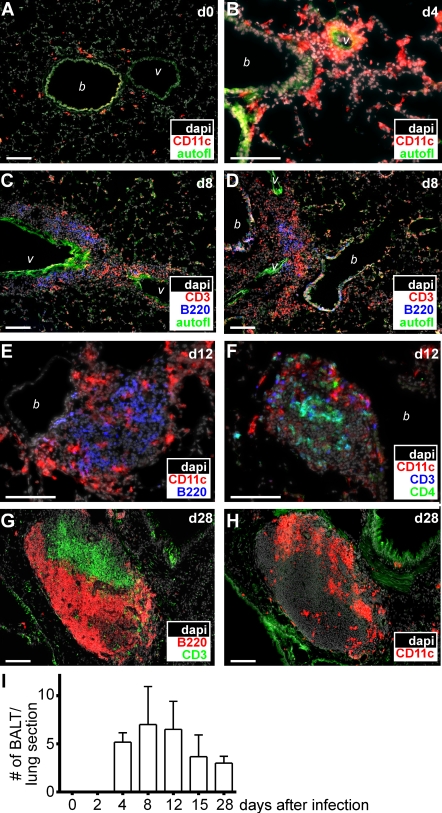
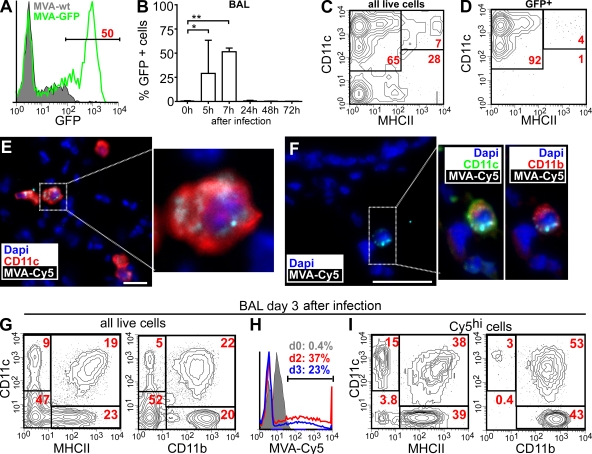
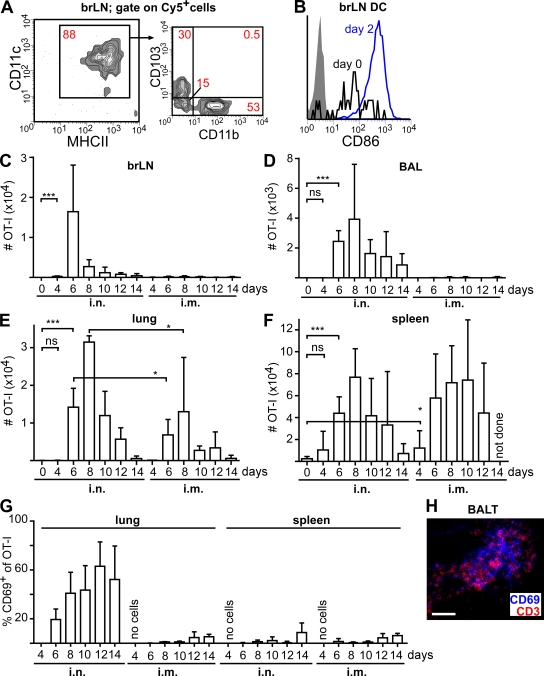
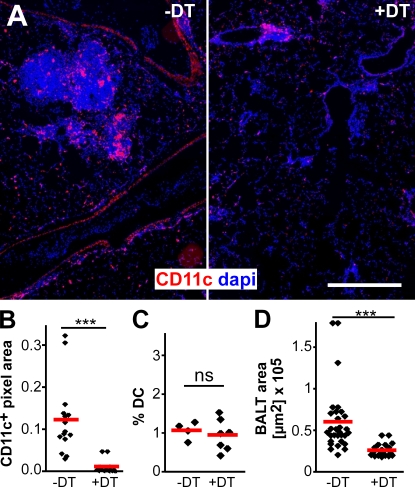
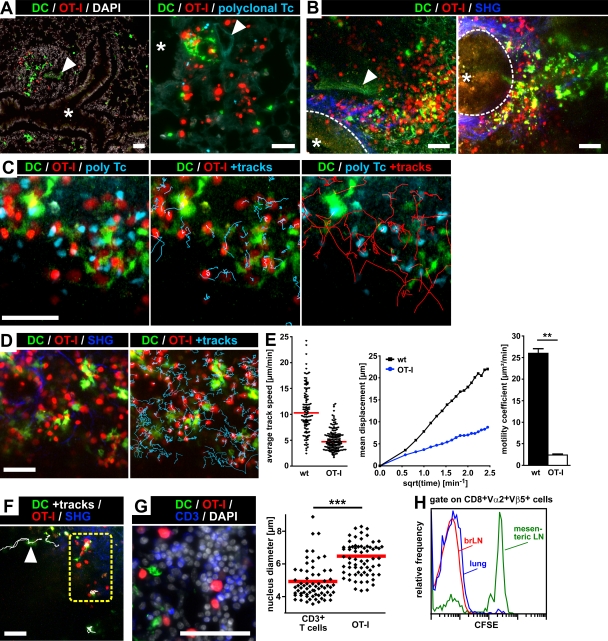
Mucosal vaccination via the respiratory tract can elicit protective immunity in animal infection models, but the underlying mechanisms are still poorly understood. We show that a single intranasal application of the replication-deficient modified vaccinia virus Ankara, which is widely used as a recombinant vaccination vector, results in prominent induction of bronchus-associated lymphoid tissue (BALT). Although initial peribronchiolar infiltrations, characterized by the presence of dendritic cells (DCs) and few lymphocytes, can be found 4 d after virus application, organized lymphoid structures with segregated B and T cell zones are first observed at day 8. After intratracheal application, in vitro-differentiated, antigen-loaded DCs rapidly migrate into preformed BALT and efficiently activate antigen-specific T cells, as revealed by two-photon microscopy. Furthermore, the lung-specific depletion of DCs in mice that express the diphtheria toxin receptor under the control of the CD11c promoter interferes with BALT maintenance. Collectively, these data identify BALT as tertiary lymphoid structures supporting the efficient priming of T cell responses directed against unrelated airborne antigens while crucially requiring DCs for its sustained presence.


Figures

Figure 1.
Figure 1.
Induction of BALT after mucosal infection with MVA. (A–H) C57/BL6 mice were infected i.n. with 107 IU MVA, and at the time points indicated (days after infection), lung sections were analyzed by fluorescence microscopy applying mAb and DAPI as indicated. Representative sections from three to six mice analyzed for each time point derived from two to three different experiments are shown. Bars, 100 µm. (I) The number of BALT structures per entire central lung section was determined by microscopy (means + SD; n = 3–5 animals per time point; pooled data are derived from six independent experiments). b, bronchioles; v, vessels.
Figure 2.
Figure 2.
Initial host cell tropism of MVA in the lung. Mice were i.n. infected with 107 IU MVA, and BAL cells were analyzed by flow cytometry. (A) GFP expression of DAPI BAL cells 7 h after infection with MVA-GFP or MVA-WT. (B) GFP expression of BAL 0–72 h after i.n. infection with MVA-GFP (mean + SD; n = 2–3 mice/time point). (C and D) Expression of CD11c and MHCII on all (C) or GFP+ (D) DAPI BAL cells 7 h after infection with MVA-GFP. (E) Immunohistology of lung sections 6 h after i.n. application of Cy5-labeled MVA using antibodies and dyes as indicated. (F) As in E, we obtained sections from lungs 30 min after MVA-Cy5 application. Bars, 25 µm. (G–I) FACS analysis of BAL cells 3 d after MVA-Cy5 application using antibodies and virus as indicated. (G and H) Gate on all DAPI cells. (I) Gate on all DAPI MVA-Cy5+ cells. The FACS plots and immunohistology shown are representative of three independent experiments, each with two to three mice analyzed per time point. *, P < 0.05; **, P < 0.01.
Figure 3.
Figure 3.
i.n. vaccination with recombinant MVA induces a distinct population of antigen-specific cytotoxic T cells in the lung. (A) Mice i.n. received 107 IU MVA-Cy5, and 3 d later the phenotype of Cy5+ cells in the draining LNs was determined by flow cytometry. (B) Expression of CD86 on CD11c+MHCII+ brLN DCs before and 2 d after i.n. instillation of MVA (shaded area, isotype control). (C–G) 1 d after the i.v. transfer of 200 CD45.1+ CD8+ OT-I T cells into CD45.2+ recipients, mice were i.n. or i.m. infected with 107 IU MVA-OVA. At the indicated time points (days after infection) the absolute number of OT-I cells was determined in the brLNs (C), BAL (D), lung (E), and spleen (F). (G) The percentage of OT-I cells expressing CD69 in the lung and spleen. (H) Expression of CD3 and CD69 in BALT at 12 d after infection. Bar, 50 µm. Data in A and B are representative of four mice analyzed in two independent experiments. Data shown in C–G are pooled from two independent experiments with two to three mice per time point (means + SD). *, P < 0.05; ***, P < 0.001.
Figure 4.
Figure 4.
Local depletion of DCs interferes with BALT maintenance. Mice expressing DTR under the control of the CD11c promoter (CD11c-DOG) were infected twice with 107 IU MVA. On days 8 and 10, mice were treated i.n. with 50 ng DT (+DT) or with PBS (−DT). (A) Lung sections from DT-treated or untreated mice stained with DAPI and anti-CD11c. Bar, 200 µm. (B) Micrographs were quantitatively analyzed for the presence of anti-CD11c signals. (C) No change in the percentage of DCs in the mesenteric LNs was detected by flow cytometry. Pooled data from three experiments, each with one to two mice per group, are shown. (D) The number and size of individual BALT structures from DT-treated or untreated mice were determined on large composite images of entire lung sections (n = 6 mice /group in B and D with two to three lung sections per mouse in two independent experiments analyzed). Symbols represent the mean BALT size per lung, and red bars represent means. ***, P < 0.001.
Figure 5.
Figure 5.
Visualization of antigen-specific T cell–DC interactions during T cell priming within BALT. TAMRA-labeled CD8+ OT-I T cells and CMAC-labeled polyclonal CD8+ WT T cells were injected i.v. into BALT-bearing recipients. 24 h later, SIINFEKL-loaded EGFP+ bone marrow–derived DCs (Ag-DCs) were i.t. transferred into the same animals, and lungs were explanted an additional 24 or 48 h later. (A) Cryosections of paraformaldehyde (PFA)-fixated lungs isolated 24 h after i.t. transfer of Ag-DCs into MVA-treated WT mice. (left) EGFP+ Ag-DCs and TAMRA+ OT-I T cells localize into BALT. (right) Higher magnification image of a BALT structure harboring Ag-DCs, OT-I T cells, and polyclonal CD8+ WT T cells. (B) Visualization of BALT within lungs of MVA-treated WT (left) or CCR7−/− (right) mice by ex vivo two-photon microscopy. Maximum intensity projections of three-dimensional imaging volumes (left: eight Z-slices, 7.5-µm spacing; right: seven Z-slices, 6-µm spacing). Collagen fibers surrounding the basal surface of the bronchial epithelium (dashed line) are visualized by SHG. Asterisks represent the bronchial lumen, and arrowheads indicate a blood vessel. (C) Analysis of T cell–DC interactions within BALT of MVA-treated WT mice by two-photon microscopy (excitation wavelength = 780 nm). 24 h after i.t. transfer of EGFP+ Ag-DCs, TAMRA+ OT-I T cells exhibit a highly confined migration behavior in the vicinity of Ag-DCs. In contrast, CMAC+ polyclonal WT control T cells display a much higher motility (Video 1). (D) The experiment was performed as in C but imaged at 865 nm (Video 2). (E) Motility parameter analysis for OT-I and polyclonal CD8+ WT T cells migrating within BALT 24 h after transfer of Ag-DCs. (left) Dots represent individual cell tracks, and bars indicate median average track speed. (middle) Mean displacement plots. (right) Motility coefficient (means + SD). **, P < 0.01. (F) 24 h after i.t. transfer of Ag-DCs into CCR7−/− recipients, EGFP+ DCs were found to enter BALT by directional interstitial migration (arrowhead; Video 3). In contrast, DCs remain largely stationary during Ag presentation within BALT (dashed yellow box; Video 3). Data in A–F are representative of two to four mice per group in two independent experiments. (G) TAMRA+ OT-I T cells within BALT display enlarged cell bodies and nuclei 48 h after i.t. transfer of Ag-DCs. The maximum diameters of DAPI-stained nuclei of TAMRA+ (OT-I) as well as TAMRACD3+ endogenous T cells within BALT were measured on cryosections. Individual values (dots) and means (red bars) of 140 randomly chosen cells from four sections from two mice are shown. ***, P < 0.001. (H) CSFE profiles of OT-I T cells isolated from the lung, brLNs, or mesenteric LNs 4 d after the i.t. transfer of Ag-DCs in mice treated with FTY720 (initial gavage of 1 mg/kg of body weight on day 0, with drinking water supplemented with 2.5 µg/ml FTY720 afterward; representative data of four mice analyzed in two independent experiments). Bars, 50 µm.

References

    1. Albrecht M., Suezer Y., Staib C., Sutter G., Vieths S., Reese G. 2008. Vaccination with a Modified Vaccinia Virus Ankara-based vaccine protects mice from allergic sensitization. J. Gene Med. 10:1324–1333 10.1002/jgm.1256 - DOI - PubMed
    1. Bienenstock J., Befus D. 1984. Gut- and bronchus-associated lymphoid tissue. Am. J. Anat. 170:437–445 10.1002/aja.1001700316 - DOI - PubMed
    1. Corbett M., Bogers W.M., Heeney J.L., Gerber S., Genin C., Didierlaurent A., Oostermeijer H., Dubbes R., Braskamp G., Lerondel S., et al. 2008. Aerosol immunization with NYVAC and MVA vectored vaccines is safe, simple, and immunogenic. Proc. Natl. Acad. Sci. USA. 105:2046–2051 10.1073/pnas.0705191105 - DOI - PMC - PubMed
    1. Förster R., Schubel A., Breitfeld D., Kremmer E., Renner-Müller I., Wolf E., Lipp M. 1999. CCR7 coordinates the primary immune response by establishing functional microenvironments in secondary lymphoid organs. Cell. 99:23–33 10.1016/S0092-8674(00)80059-8 - DOI - PubMed
    1. Gherardi M.M., Esteban M. 2005. Recombinant poxviruses as mucosal vaccine vectors. J. Gen. Virol. 86:2925–2936 10.1099/vir.0.81181-0 - DOI - PubMed

Publication types