. 2010 Jan 10;28(2):245-55.
doi: 10.1200/JCO.2008.21.5988. Epub 2009 Nov 16.

Pancreatic endocrine tumors: expression profiling evidences a role for AKT-mTOR pathway

Affiliations

Pancreatic endocrine tumors: expression profiling evidences a role for AKT-mTOR pathway

Edoardo Missiaglia et al. J Clin Oncol. .

Abstract

Purpose: We investigated the global gene expression in a large panel of pancreatic endocrine tumors (PETs) aimed at identifying new potential targets for therapy and biomarkers to predict patient outcome.

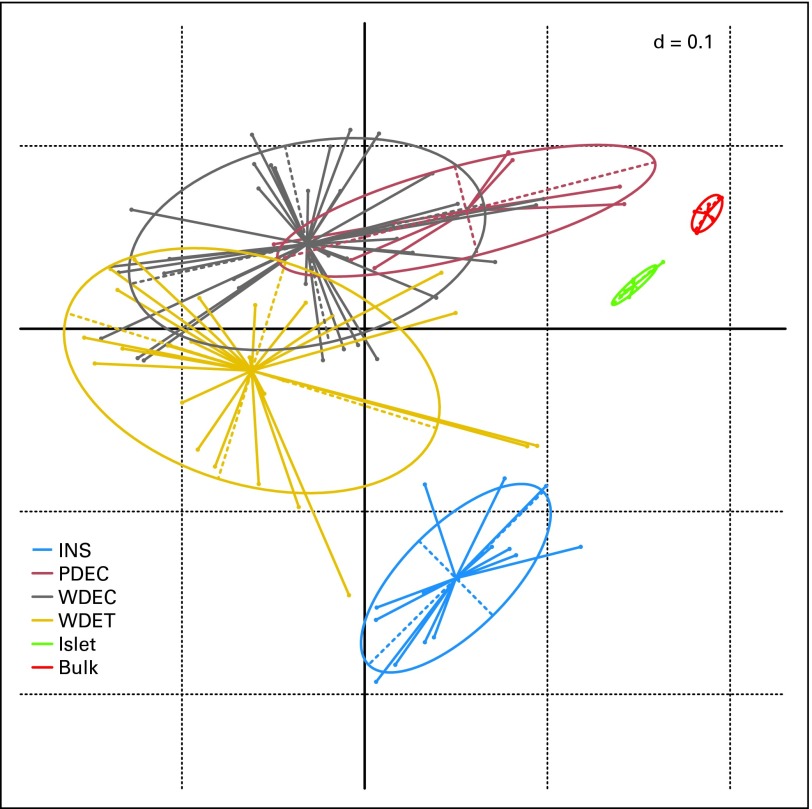
Patients and methods: Using a custom microarray, we analyzed 72 primary PETs, seven matched metastases, and 10 normal pancreatic samples. Relevant differentially expressed genes were validated by either quantitative real-time polymerase chain reaction or immunohistochemistry on tissue microarrays.

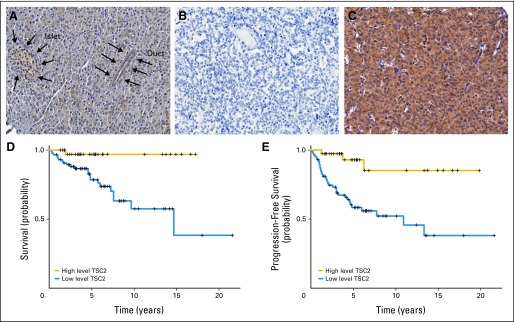
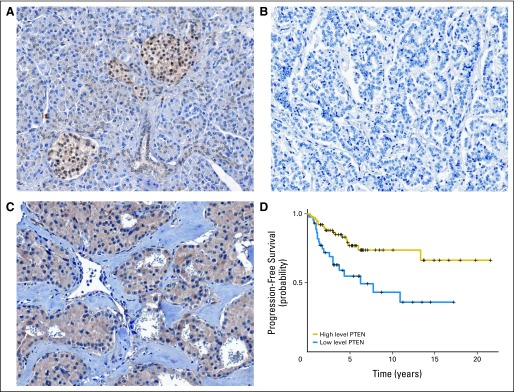
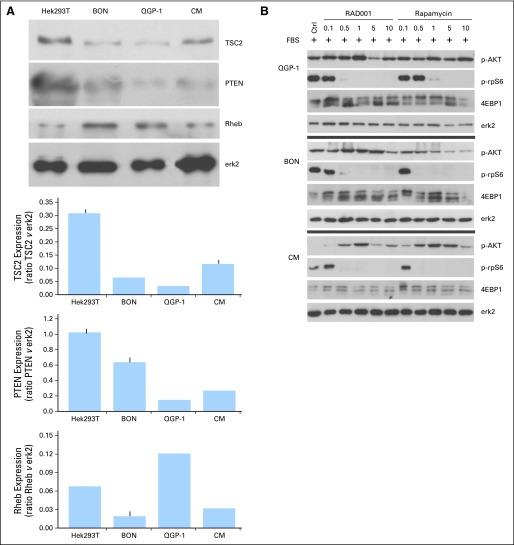
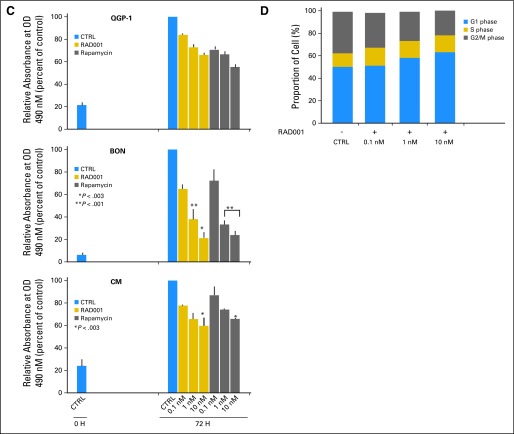
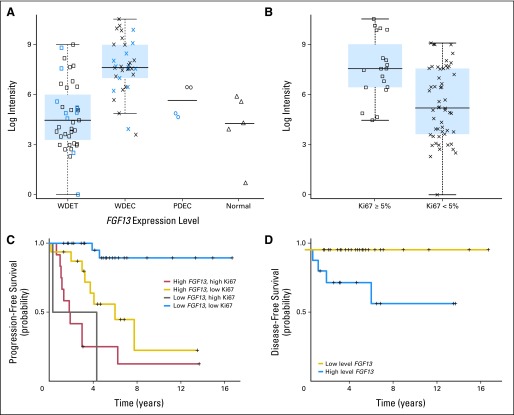
Results: Our data showed that: tuberous sclerosis 2 (TSC2) and phosphatase and tensin homolog (PTEN) were downregulated in most of the primary tumors, and their low expression was significantly associated with shorter disease-free and overall survival; somatostatin receptor 2 (SSTR2) was absent or very low in insulinomas compared with nonfunctioning tumors; and expression of fibroblast growth factor 13 (FGF13) gene was significantly associated with the occurrence of liver metastasis and shorter disease-free survival. TSC2 and PTEN are two key inhibitors of the Akt/mammalian target of rapamycin (mTOR) pathway and the specific inhibition of mTOR with rapamycin or RAD001 inhibited cell proliferation of PET cell lines.

Conclusion: Our results strongly support a role for PI3K/Akt/mTOR pathway in PET, which ties in with the fact that mTOR inhibitors have reached phase III trials in neuroendocrine tumors. The finding of differential SSTR expression raises the potential for SSTR expression to be evaluated as a marker of response to somatostatin analogs. Finally, we identified FGF13 as a new prognostic marker that predicted poorer outcome in patients who were clinically considered free from disease.


Conflict of interest statement

Authors' disclosures of potential conflicts of interest and author contributions are found at the end of this article.

Figures

Fig 1.
Fig 1.
Bidimensional projection of the expression profiles of pancreatic endocrine tumors (PETs) and normal samples by correspondence analysis. Projection of PETs and normal samples into two-dimensional space using the top 1,000 probes with the highest interquartile range. Bulk tissues, islet cells, insulinomas (INS), and nonfunctioning PETs showed a distinctive pattern of expression, which projects them in different regions of the plane. PDEC, poorly differentiated endocrine carcinoma; WDEC, well-differentiated endocrine carcinoma; WDET, well-differentiated endocrine tumor; Islet, normal pancreatic islets of Langerhans; Bulk, normal bulk tissue.
Fig 2.
Fig 2.
Tuberous sclerosis 2 (TSC2) protein expression and its correlation with survival in pancreatic endocrine tumors (PETs). Immunohistochemistry with antituberin antibody (Novocastra, Newcastle, United Kingdom). Original magnification: ×20. (A) Normal pancreatic tissue with an islet and duct (indicated by arrows), the cells of which show a cytoplasmic staining stronger than that seen in acini; (B) PET tissue with negative staining; (C) PET tissue with strong staining. Correlation of tuberin immunostaining with (D) overall survival and (E) progression-free survival. High level TSC2, staining score higher than 2; low level TSC2, staining score ≤ 2.
Fig 3.
Fig 3.
Phosphatase and tensin homolog (PTEN) protein expression and its correlation with survival in pancreatic endocrine tumors (PETs). Immunohistochemistry with anti-PTEN antibody (Cell Signaling Technology, Beverly, MA). Original magnification: ×20. (A) Normal pancreatic tissue with islets showing strongly stained cytoplasm and nuclei; (B) PET tissue with negative staining; (C) PET tissue with strong cytoplasmic and nuclear protein expression. (D) Correlation between PTEN immunostaining and disease-free survival. High level PTEN, staining score ≥ 2; low level PTEN, staining score < 2.
Fig 4.
Fig 4.
Effect of the treatment of pancreatic endocrine tumor cell lines with mammalian target of rapamycin (mTOR) inhibitors. (A) Protein expression of the three regulators of AKT/mTOR pathway, tuberous sclerosis 2 (TSC2), phosphatase and tensin homolog (PTEN), and Rheb in the pancreatic endocrine cell lines QGP-1, BON, and CM, and relative densitometries (Hek293T cells were used as control). (B) QGP-1, BON, and CM were stimulated with fetal bovine serum for 2 hours and then treated with rapamycin or RAD001 at the indicated concentrations for 24 hours. One representative blot is shown. (C) QGP-1, BON, and CM were treated with rapamycin or RAD001 for 72 hours. The cell proliferation rate was measured by CellTiter 96 kit (Promega, Madison, WI). Means and standard deviations of three independent experiments are reported. P represents the significance of each treatment versus untreated control. (D) BON cells were treated for 72 hours with RAD001. Cell cycle was analyzed by flow cytometry. OD, optical density.
Fig 4.
Fig 4.
Effect of the treatment of pancreatic endocrine tumor cell lines with mammalian target of rapamycin (mTOR) inhibitors. (A) Protein expression of the three regulators of AKT/mTOR pathway, tuberous sclerosis 2 (TSC2), phosphatase and tensin homolog (PTEN), and Rheb in the pancreatic endocrine cell lines QGP-1, BON, and CM, and relative densitometries (Hek293T cells were used as control). (B) QGP-1, BON, and CM were stimulated with fetal bovine serum for 2 hours and then treated with rapamycin or RAD001 at the indicated concentrations for 24 hours. One representative blot is shown. (C) QGP-1, BON, and CM were treated with rapamycin or RAD001 for 72 hours. The cell proliferation rate was measured by CellTiter 96 kit (Promega, Madison, WI). Means and standard deviations of three independent experiments are reported. P represents the significance of each treatment versus untreated control. (D) BON cells were treated for 72 hours with RAD001. Cell cycle was analyzed by flow cytometry. OD, optical density.
Fig 5.
Fig 5.
Somatostatin receptor 2 (SSTR2) protein expression in normal pancreatic tissue, nonfunctioning pancreatic endocrine tumors (NF-PETs), and insulinomas. Immunohistochemistry with anti-SSTR2 antibody (Biotrend/Gramsch Laboratories, Schwabhausen, Germany). Original magnification: ×20. (A) Normal pancreatic tissue showing a moderate membranous staining in islet cells; (B) insulinoma tissue with negative membranous staining; (C) NF-PET tissue with strong membranous staining.
Fig 6.
Fig 6.
Fibroblast growth factor 13 (FGF13) mRNA expression in pancreatic endocrine tumors (PETs). (A) FGF13 expression measured by quantitative real-time polymerase chain reaction in normal pancreas (two normal bulk pancreas and three islet cell samples) and 77 PETs. These latter comprised 55 cases belonging to the series profiled by microarray (indicated in black) and 22 new cases (indicated in blue). (B) FGF13 expression in patients with low (Ki67 < 5%) and high (Ki67 ≥ 5%) proliferative index. (C,D) Correlation between FGF13 mRNA level and progression-free and disease-free survival, respectively. WDET, well-differentiated tumor; WDEC, well-differentiated carcinoma; PDEC, poorly differentiated carcinoma.

References

    1. Yao JC, Eisner MP, Leary C, et al. Population-based study of islet cell carcinoma. Ann Surg Oncol. 2007;14:3492–3500. - PMC - PubMed
    1. Kloppel G, Perren A, Heitz PU. The gastroenteropancreatic neuroendocrine cell system and its tumors: The WHO classification. Ann N Y Acad Sci. 2004;1014:13–27. - PubMed
    1. Bettini R, Boninsegna L, Mantovani W, et al. Prognostic factors at diagnosis and value of WHO classification in a mono-institutional series of 180 non-functioning pancreatic endocrine tumours. Ann Oncol. 2008;19:903–908. - PubMed
    1. Pape UF, Jann H, Muller-Nordhorn J, et al. Prognostic relevance of a novel TNM classification system for upper gastroenteropancreatic neuroendocrine tumors. Cancer. 2008;113:256–265. - PubMed
    1. Fazio N, de Braud F, Delle Fave G, et al. Interferon-alpha and somatostatin analog in patients with gastroenteropancreatic neuroendocrine carcinoma: Single agent or combination? Ann Oncol. 2007;18:13–19. - PubMed

Publication types

Substances