. 2010 Feb;33(2):327-34.
doi: 10.2337/dc09-0493. Epub 2009 Nov 16.

Deleterious associations of sitting time and television viewing time with cardiometabolic risk biomarkers: Australian Diabetes, Obesity and Lifestyle (AusDiab) study 2004-2005

Affiliations

Deleterious associations of sitting time and television viewing time with cardiometabolic risk biomarkers: Australian Diabetes, Obesity and Lifestyle (AusDiab) study 2004-2005

Alicia A Thorp et al. Diabetes Care. 2010 Feb.

Abstract

Objective: We examined the associations of sitting time and television (TV) viewing time with continuously measured biomarkers of cardio-metabolic risk in Australian adults.

Research design and methods: Waist circumference, BMI, resting blood pressure, triglycerides, HDL cholesterol, fasting and 2-h postload plasma glucose, and fasting insulin were measured in 2,761 women and 2,103 men aged > or =30 years (mean age 54 years) without clinically diagnosed diabetes from the 2004-2005 Australian Diabetes, Obesity and Lifestyle (AusDiab) study. Multivariate linear regression analyses examined associations of self-reported sitting time and TV viewing time (hours per day) with these biomarkers, adjusting for potential confounding variables.

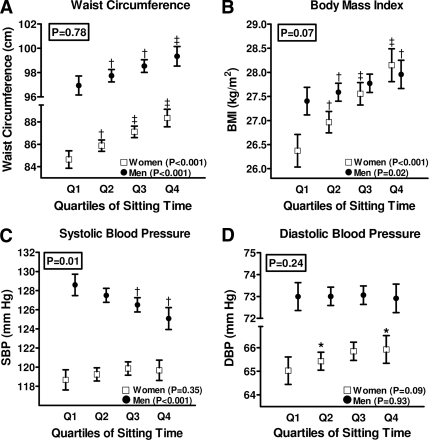
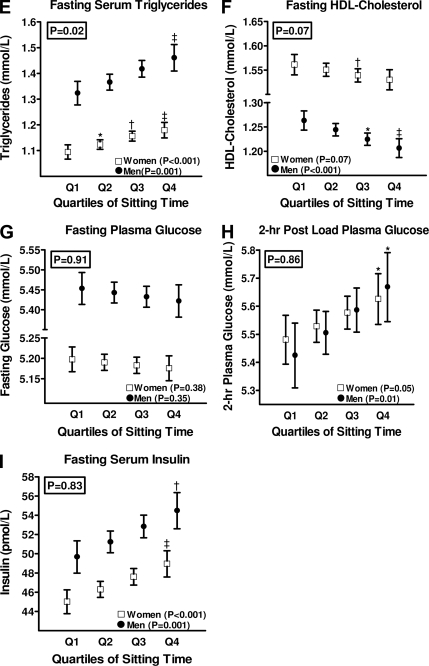
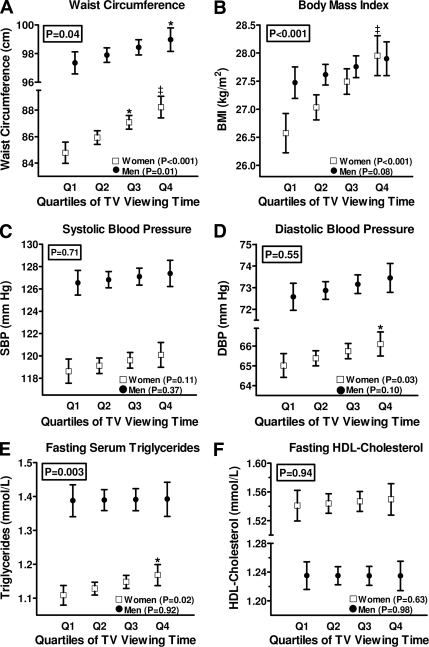
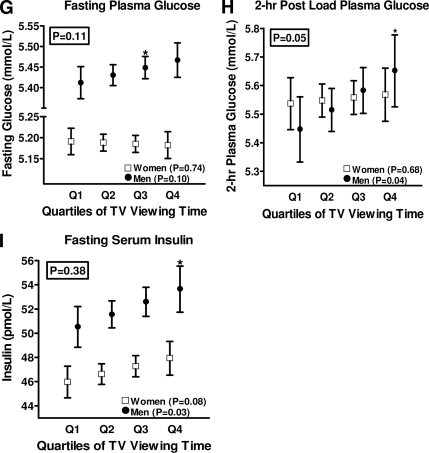
Results: For both women and men, sitting time was detrimentally associated with waist circumference, BMI, systolic blood pressure, fasting triglycerides, HDL cholesterol, 2-h postload plasma glucose, and fasting insulin (all P < 0.05), but not with fasting plasma glucose and diastolic blood pressure (men only). With the exception of HDL cholesterol and systolic blood pressure in women, the associations remained significant after further adjustment for waist circumference. TV viewing time was detrimentally associated with all metabolic measures in women and all except HDL cholesterol and blood pressure in men. Only fasting insulin and glucose (men only) remained deleteriously associated with TV viewing time after adjustment for waist circumference.

Conclusions: In women and men, sitting time and TV viewing time were deleteriously associated with cardio-metabolic risk biomarkers, with sitting time having more consistent associations in both sexes and being independent of central adiposity. Preventive initiatives aimed at reducing sitting time should focus on both nonleisure and leisure-time domains.


Figures

Figure 1
Figure 1
Associations of individual metabolic risk variables with quartiles of sitting time for women (□) and men (●). Data are presented as marginal means (95% CI) adjusted for waist circumference (except for waist circumference and BMI outcomes), age, education, parental history of diabetes, employment status, cigarette smoking, total alcohol and total energy intake, diet quality, and leisure physical activity time. For insulin, triglycerides, HDL cholesterol, and fasting and 2-h postload plasma glucose, P values for trend and between individual quartiles of sitting time from reference category (Q1) are derived from the natural logarithm of these values. To allow for clinical interpretation, marginal means (95% CI) are presented as back-transformed log values. *P ≤ 0.05; †P ≤ 0.01; ‡P ≤ 0.001. Sex interaction P values are presented in the box. DBP, diastolic blood pressure; SBP, systolic blood pressure.
Figure 1
Figure 1
Associations of individual metabolic risk variables with quartiles of sitting time for women (□) and men (●). Data are presented as marginal means (95% CI) adjusted for waist circumference (except for waist circumference and BMI outcomes), age, education, parental history of diabetes, employment status, cigarette smoking, total alcohol and total energy intake, diet quality, and leisure physical activity time. For insulin, triglycerides, HDL cholesterol, and fasting and 2-h postload plasma glucose, P values for trend and between individual quartiles of sitting time from reference category (Q1) are derived from the natural logarithm of these values. To allow for clinical interpretation, marginal means (95% CI) are presented as back-transformed log values. *P ≤ 0.05; †P ≤ 0.01; ‡P ≤ 0.001. Sex interaction P values are presented in the box. DBP, diastolic blood pressure; SBP, systolic blood pressure.
Figure 2
Figure 2
Associations of individual metabolic risk variables with quartiles of TV viewing time for women (□) and men (●). Data are presented as marginal means (95% CI) adjusted for waist circumference (except for waist circumference and BMI outcomes), age, education, parental history of diabetes, employment status, cigarette smoking, total alcohol and total energy intake, diet quality, and leisure physical activity time. For insulin, triglycerides, HDL cholesterol, and fasting and 2-h postload plasma glucose, P values for trend and between individual quartiles of TV viewing time from reference category (Q1) are derived from the natural logarithm of these values. To allow for clinical interpretation, marginal means (95% CI) are presented as back-transformed log values. *P ≤ 0.05; †P ≤ 0.01; ‡P ≤ 0.001. Sex interaction P values are presented in the box.
Figure 2
Figure 2
Associations of individual metabolic risk variables with quartiles of TV viewing time for women (□) and men (●). Data are presented as marginal means (95% CI) adjusted for waist circumference (except for waist circumference and BMI outcomes), age, education, parental history of diabetes, employment status, cigarette smoking, total alcohol and total energy intake, diet quality, and leisure physical activity time. For insulin, triglycerides, HDL cholesterol, and fasting and 2-h postload plasma glucose, P values for trend and between individual quartiles of TV viewing time from reference category (Q1) are derived from the natural logarithm of these values. To allow for clinical interpretation, marginal means (95% CI) are presented as back-transformed log values. *P ≤ 0.05; †P ≤ 0.01; ‡P ≤ 0.001. Sex interaction P values are presented in the box.

References

    1. Hamilton MT, Healy G, Dunstan D, Zderic TW, Owen N. Too little exercise and too much sitting: inactivity physiology and the need for new recommendations on sedentary behaviour. Current Cardiovascular Risk Reports 2008; 2: 292– 298 - PMC - PubMed
    1. Hu FB, Li TY, Colditz GA, Willett WC, Manson JE. Television watching and other sedentary behaviors in relation to risk of obesity and type 2 diabetes mellitus in women. JAMA 2003; 289: 1785– 1791 - PubMed
    1. Dunstan DW, Salmon J, Owen N, Armstrong T, Zimmet PZ, Welborn TA, Cameron AJ, Dwyer T, Jolley D, Shaw JEAusDiab Steering Committee. Associations of TV viewing and physical activity with the metabolic syndrome in Australian adults. Diabetologia 2005; 48: 2254– 2261 - PubMed
    1. Healy GN, Dunstan DW, Salmon J, Shaw JE, Zimmet PZ, Owen N. Television time and continuous metabolic risk in physically active adults. Med Sci Sports Exerc 2008; 40: 639– 645 - PubMed
    1. Dunstan DW, Salmon J, Healy GN, Shaw JE, Jolley D, Zimmet PZ, Owen NAusDiab Steering Committee. Association of television viewing with fasting and 2-h post challenge plasma glucose levels in adults without diagnosed diabetes. Diabetes Care 2007; 30: 516– 522 - PubMed

Publication types

MeSH terms