

Hierarchical computation in the canonical auditory cortical circuit
- PMID: 19918079
- PMCID: PMC2799842
- DOI: 10.1073/pnas.0908383106
Hierarchical computation in the canonical auditory cortical circuit
Abstract
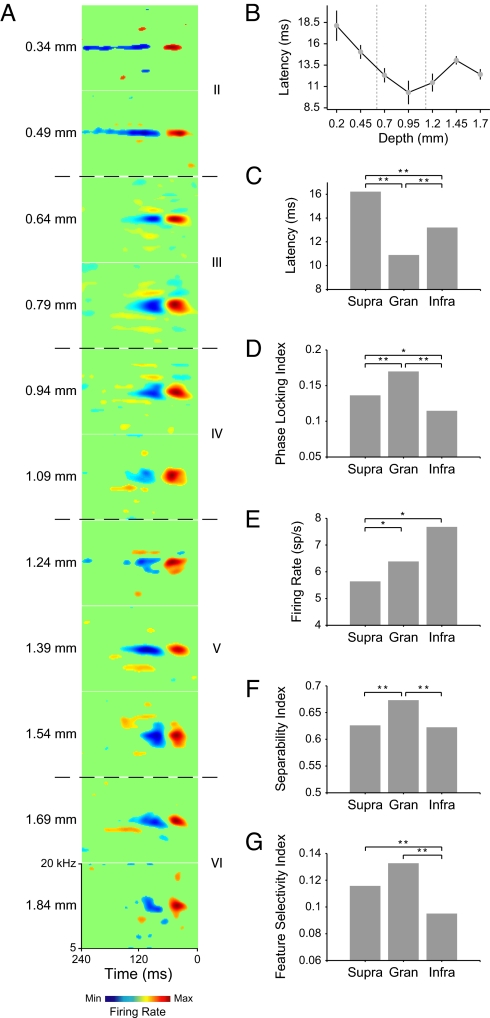
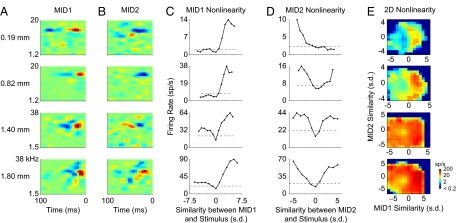
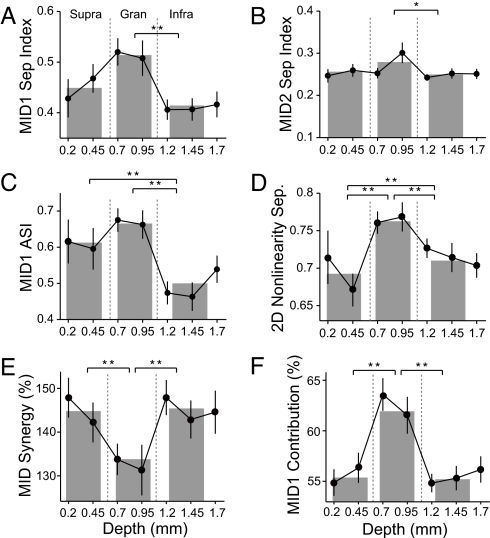
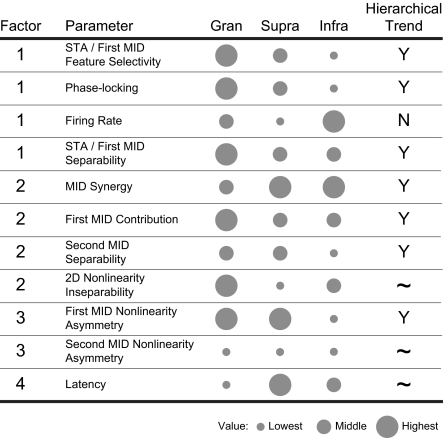
Sensory cortical anatomy has identified a canonical microcircuit underlying computations between and within layers. This feed-forward circuit processes information serially from granular to supragranular and to infragranular layers. How this substrate correlates with an auditory cortical processing hierarchy is unclear. We recorded simultaneously from all layers in cat primary auditory cortex (AI) and estimated spectrotemporal receptive fields (STRFs) and associated nonlinearities. Spike-triggered averaged STRFs revealed that temporal precision, spectrotemporal separability, and feature selectivity varied with layer according to a hierarchical processing model. STRFs from maximally informative dimension (MID) analysis confirmed hierarchical processing. Of two cooperative MIDs identified for each neuron, the first comprised the majority of stimulus information in granular layers. Second MID contributions and nonlinear cooperativity increased in supragranular and infragranular layers. The AI microcircuit provides a valid template for three independent hierarchical computation principles. Increases in processing complexity, STRF cooperativity, and nonlinearity correlate with the synaptic distance from granular layers.
Conflict of interest statement
The authors declare no conflict of interest.
Figures
Comment in
-
New perspectives of information transformation through the auditory cortical layers.Proc Natl Acad Sci U S A. 2009 Dec 22;106(51):21463-4. doi: 10.1073/pnas.0912299107. Epub 2009 Dec 15. Proc Natl Acad Sci U S A. 2009. PMID: 20018781 Free PMC article. No abstract available.
References
-
- Douglas RJ, Martin KAC. Neuronal circuits of the neocortex. Annu Rev Neurosci. 2004;27:419–451. - PubMed
-
- Thomson AM, West DC, Wang Y, Bannister AP. Synaptic connections and small circuits involving excitatory and inhibitory neurons in layers 2–5 of adult rat and cat neocortex: Triple intracellular recordings and biocytin labeling in vitro. Cereb Cortex. 2002;12:936–953. - PubMed
-
- Mitani A, et al. Morphology and laminar organization of electrophysiologically identified neurons in the primary auditory cortex in the cat. J Comp Neurol. 1985;235:430–447. - PubMed
-
- Linden JF, Schreiner CE. Columnar transformations in auditory cortex? A comparison to visual and somatosensory cortices. Cereb Cortex. 2003;13:83–89. - PubMed
-
- Winer JA. The functional architecture of the medial geniculate body and the primary auditory cortex. In: Webster DB, Popper AN, Fay RR, editors. The Mammalian Auditory Pathway: Neuroanatomy. New York: Springer; 1992. pp. 222–409.
Publication types
MeSH terms
Grants and funding
LinkOut - more resources
Full Text Sources
Miscellaneous
