. 2009 Oct;68(10):1155-65.
doi: 10.1097/NEN.0b013e3181ba3952.

Genomic profiling of atypical meningiomas associates gain of 1q with poor clinical outcome

Affiliations

Genomic profiling of atypical meningiomas associates gain of 1q with poor clinical outcome

Darlene Gabeau-Lacet et al. J Neuropathol Exp Neurol. 2009 Oct.

Abstract

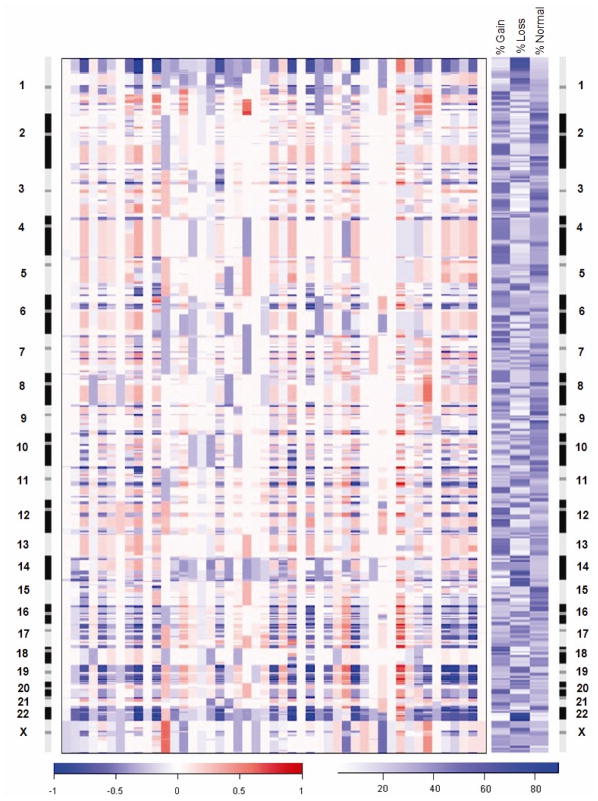
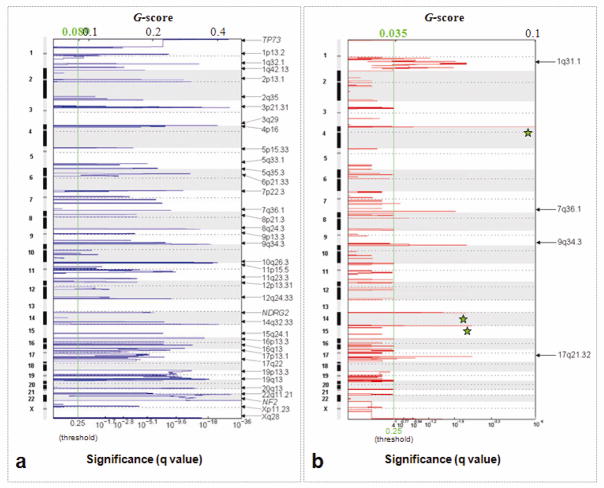
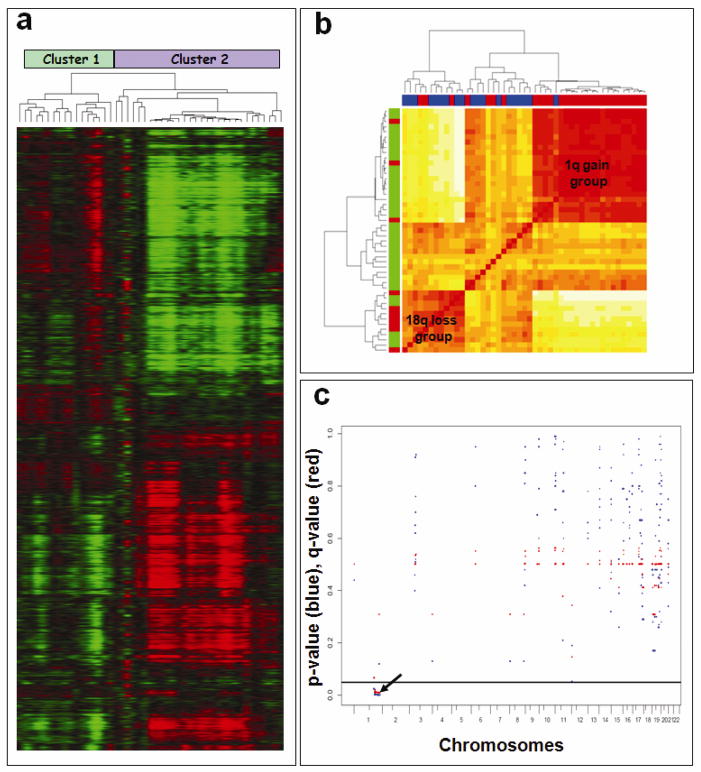
Atypical meningiomas exhibit heterogeneous clinical outcomes. It is unclear which atypical meningiomas require aggressive multimodality treatment with surgery and radiation therapy versus surgery alone to prevent recurrence. Detailed molecular-genetic characterization of these neoplasms is necessary to understand their pathogenesis and identify clinically relevant genetic markers. Oligonucleotide array comparative genomic hybridization was used to identify frequent genetic alterations in 47 primary atypical meningiomas resected at Massachusetts General Hospital between August 1987 and September 2006. Eighty-five percent of samples exhibited loss of 22q, including the neurofibromatosis type 2 gene. The second most frequent regions of loss were confined to the short arm of chromosome 1, particularly 1p33-p36.2 (70%) and 1p13.2 (64%). Other frequent regions of loss, detected in more than 50% of samples, included 14q, 10q, 8q, 7p, 21q, 19, 9q34, and 4p16. Frequent regions of gain were detected along 1q (59%), 17q (44%), 9q34 (30%), and 7q36 (26%). Univariate marker-by-marker analysis of all frequently identified copy number alterations showed potential correlation between gain of 1q and shorter progression-free survival. Given the heterogeneous treatment outcomes of atypical meningioma, investigation of large-scale and focal genomic alterations in multi-institutional efforts may help clarify molecular-genetic signatures of clinical use.


Figures

Figure 1
Figure 1
Genomic profiles of 47 primary atypical meningiomas generated by oligonucleotide array CGH. Each column in the left panel represents a tumor sample and rows represent losses and gains of DNA sequences along the length of chromosomes 1 through X as determined by the segmentation analysis of normalized log2 ratios. The color scale ranges from blue (loss) through white (two copies) to red (gain). The right panel indicates the frequencies of gain and loss of oligonucleotide probes on a probe-by-probe basis for all autosomes and the X chromosome. The color scale ranges from white (no changes) to blue (frequent changes). Loss of 22q12.2 including the NF2 gene was the most frequent alteration observed in 85% of the atypical meningiomas.
Figure 2
Figure 2
GISTIC analysis of copy number alterations in atypical meningiomas. The statistical significance of the aberrations identified by GISTIC are displayed as false discovery rate q values to account for multiple hypothesis testing (q values; green line is 0.25 cut-off for significance). Scores for each alteration are plotted along x axis and the genomic positions are plotted along y axis; dotted lines indicate the centromeres. a) Loss of both broad and focal regions are identified by GISTIC (copy number threshold = log2 ratio ≤ 0.4 for broad and ≤ 0.1 for focal events). Sixty five broad regions of losses were identified. Three focal events indicated by the gene names were identified in the background of broad regions. b) GISTIC reveals five broad regions of gain (copy number threshold = log2 ratio ≥ 0.4). Green stars indicate known or presumed copy number polymorphisms.
Figure 3
Figure 3
Cluster analysis of copy number alterations in atypical meningiomas. a) Unsupervised hierarchical clustering of CGHsmooth transformed dataset derived from 47 primary atypical meningiomas. Copy number values are color coded as follows: green (loss), black (normal) and red (gain). The pattern of dendrogram suggests two major genomic subgroups of atypical meningiomas. b) The distance matrix of all copy number alterations included in the heatmap (Pearson distance). Majority of the samples with 1q gain (indicated in Red on the horizontal side bar) and 18q loss (indicated in Red on the vertical side bar) cluster together. c) Marker-by-marker assessment of DNA copy number gains reveals association between 1q gain and shorter progression-free survival. P-values (Cox model) are denoted in red. Q-values are denoted in blue. The horizontal black line at 0.05 denotes the chosen significance level. Long tick marks along the bottom axis denote chromosome ends whereas short tick marks denote the centromere.

References

    1. Goyal LK, Suh JH, Mohan DS, Prayson RA, Lee J, Barnett GH. Local control and overall survival in atypical meningioma: a retrospective study. Int J Radiat Oncol Biol Phys. 2000;46:57–61. - PubMed
    1. Dziuk TW, Woo S, Butler EB, Thornby J, Grossman R, Dennis WS, Lu H, Carpenter LS, Chiu JK. Malignant meningioma: an indication for initial aggressive surgery and adjuvant radiotherapy. J Neurooncol. 1998;37:177–88. - PubMed
    1. Louis D, Ohgaki H, Wiestler O, Cavenee W, editors. WHO Classification of Tumours of the Central Nervous System. Lyon, France: IARC Press; 2007. - PMC - PubMed
    1. Willis J, Smith C, Ironside JW, Erridge S, Whittle IR, Everington D. The accuracy of meningioma grading: a 10-year retrospective audit. Neuropathol Appl Neurobiol. 2005;31:141–9. - PubMed
    1. Palma L, Celli P, Franco C, Cervoni L, Cantore G. Long-term prognosis for atypical and malignant meningiomas: a study of 71 surgical cases. J Neurosurg. 1997;86:793–800. - PubMed

Publication types