

doi: 10.1371/journal.pbio.1000242.
Epub 2009 Nov 17.
Article-level metrics and the evolution of scientific impact
Affiliations
- PMID: 19918558
- PMCID: PMC2768794
- DOI: 10.1371/journal.pbio.1000242
Item in Clipboard
Article-level metrics and the evolution of scientific impact
PLoS Biol.
2009 Nov.
Abstract
The authors discuss the value of article-level metrics in determining an article's scientific impact.
Conflict of interest statement
The authors have declared that no competing interests exist.
Figures
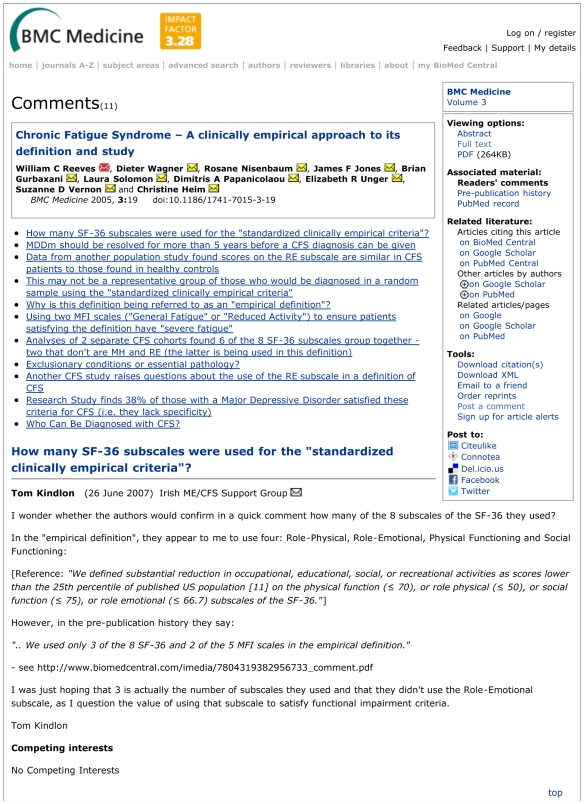
The comments shown are for an article published in BMC Medicine . Full names and affiliations are typically given and commenters also indicate conflicts of interest. Readers must also be logged in to comment. Note that conversations are not threaded—meaning that replies cannot be formally directed towards specific comments—though commenters sometimes indicate whether their comment pertains to a specific comment via the “re:” designation in the comment title.

The comments shown are for a research article published in early 2009 . Full names and affiliations are typically given, and commenters indicate conflicts of interest but no login is needed to comment. As with BMC articles, threading is not formally implemented.
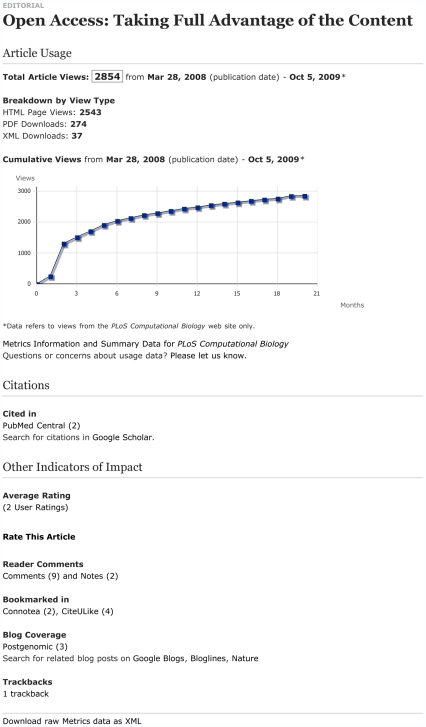
Shown here are article-level metrics for a recent article in PLoS Comput Biol
, accessible by clicking the “Metrics” tab on the article Web page. At the top, page view and download counts provide an immediate measure of the number of times people accessed the article via the journal Web site. The plot showing cumulative views gives a sense of the trend in views over time. Citations are shown next and refer to the number of other articles that have referenced this one as indexed in citation databases; PubMed Central and Google Scholar in this case. Citations typically take months or years to appear, but are better indicators of how many other articles have built upon the work. “Other Indicators of Impact” include ratings and comments, which, like page views, are immediate but may offer more insight because users are more likely to have read the article and found it compelling enough to respond. Additional other indicators are bookmarks, used by some people to keep track of articles of interest to them, and blog posts and trackbacks, which indicate where else on the Web the article has been mentioned and can be useful for linking to a broader discussion. It is clear that all of the types of data provide different dimensions, which together can give a clearer picture of an article's impact.
References
-
- Garfield E. Citation analysis as a tool in journal evaluation. Science. 1972;178:471–479. - PubMed
-
- Bollen J, Rodriquez M. A, Van de Sompel H. Journal status. Scientometrics. 2006;69:669–687.
-
- Bergstrom C. Eigenfactor: measuring the value and prestige of scholarly journals. C&RL News. 2007;68(5)
-
- Bollen J, Van de Sompel H, Hagberg A, Chute R. A principal component analysis of 39 scientific impact measures. PLoS One. 2009;4:e6022. doi: 10.1371/journal.pone.0006022. - DOI - PMC - PubMed
MeSH terms
LinkOut - more resources
Full Text Sources
