. 2010 Jan;63(1):9-19.
doi: 10.1002/mrm.22182.

RF shimming for spectroscopic localization in the human brain at 7 T

Affiliations

RF shimming for spectroscopic localization in the human brain at 7 T

Hoby P Hetherington et al. Magn Reson Med. 2010 Jan.

Abstract

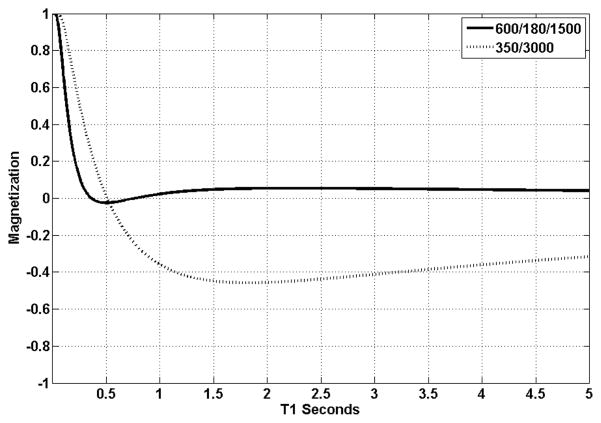
Spectroscopic imaging of the human head at short echo times (<or=15 ms) typically requires suppression of signals from extracerebral tissues. However, at 7 T, decreasing efficiency in B1+ generation (hertz/watt) and increasing spectral bandwidth result in dramatic increases in power deposition and increased chemical shift registration artifacts for conventional gradient-based in-plane localization. In this work, we describe a novel method using radiofrequency shimming and an eight-element transceiver array to generate a B1+ field distribution that excites a ring about the periphery of the head and leaves central brain regions largely unaffected. We have used this novel B1+ distribution to provide in-plane outer volume suppression (>98% suppression of extracerebral lipids) without the use of gradients. This novel B1+ distribution is used in conjunction with a double inversion recovery method to provide suppression of extracerebral resonances with T1s greater than 400 ms, while having negligible effect on metabolite ratios of cerebral resonances with T1s>1000 ms. Despite the use of two adiabatic pulses, the high efficiency of the ring distribution allows radiofrequency power deposition to be limited to 3-4 W for a pulse repetition time of 1.5 sec. The short echo time enabled the acquisition of images of the human brain, displaying glutamate, glutamine, macromolecules, and other major cerebral metabolites.


Figures

Figure 1
Figure 1
displays a scout image (1A) and the ROIs used for optimizing the homogeneous distribution ( ROIphaseHomog (1B) and ROIAmpHomog (1C)) and ring distribution ( ROIInnerRing (1D) and ROIOuterRing (1E)).
Figure 2
Figure 2
displays the two tops used for the RF coil (2A), the complete assembled elliptical coil (2B) used for human studies and the circular array (2C) used for the phantom studies.
Figure 3
Figure 3
displays the four pulse sequences used in this work. The homogeneous (RF#1) and ring distributions (RF#2) are displayed on separate lines. All sequences include slice selective excitation (orange) and 2 dimensions of phase encoding (yellow). Water suppression is provided by a frequency selective inversion and a semi-selective refocusing pulse. Gradient dephasing is used following the inversion pulses (blue) and during the spin echo (not shown for clarity). Sequence A uses the homogeneous distribution with no inversion pre-pulses. Sequence B is the same as Sequence A with addition of a non-selective inversion pulse delivered with the homogeneous distribution (RF#1), while sequences C and D include 1 and 2 inversions delivered with the ring distribution (RF#2).
Figure 4
Figure 4
displays the ROIs used to optimize the homogeneous (A) and the three ring distributions (B) for the phantom. Figures 4C–4F display the B1 maps acquired using the homogeneous distribution (C) and ring distribution with ΔφRing = π/2,3π/4 and π (D–F) Fig 4G displays a profile through the central column of the B1 maps for the four B1 distributions.
Figure 5
Figure 5
displays the ROIs used to optimize the homogeneous (A) and ring distribution (B) in a volunteer. Figures 5C and D display the acquired B1 maps. Figure 5E displays a profile of the B1 across the central row of the brain for the homogeneous and ring distributions. Figures 5F and 5G display the calculated maps of η over ROIAmpHomog(F) and ROIInnerRing and ROIOuterRing(G).
Figure 6
Figure 6
displays the head model and array with the RF shield removed for visualization purposes only (A); tissue segmentation of the brain (B); B1 (C, D) and SAR maps (E, F) for the homogeneous and ring distributions respectively. To help identify the location of the head on the B1 maps, the tissue segmented scalp component from 6B is overlaid on the B1 maps in black. The B1 maps for the homogeneous distribution and ring distribution were driven with input voltages of 1V and 0.4V(0.16), respectively, matching relative in vivo conditions. The SAR maps for the homogenous and ring distribution were calculated using summed input powers of 1W and 0.16W, respectively.
Figure 7
Figure 7
displays a scout image with overlaid spectroscopic imaging grid and a row spanning the head. Spectral data acquired from the pixels in that row are displayed below for the four pulse sequences used: (A) no IR, (B) 1 IR with the homogeneous distribution, (C) 1 IR with the ring distribution and (D) 2 IRs with the ring distribution.
Figure 8
Figure 8
displays a plot of the resulting magnetization as a function of T1 for the single (dashed line) and double IR (solid line) methods.
Figure 9
Figure 9
displays a contour plot of the fraction of signal retained following the double IR as a function of T1 and B1.
Figure 10
Figure 10
displays: A) a scout image, B) an NAA image, C) a creatine/NAA image and D) a glutamate/NAA image. Displayed in 9E are a scout image showing the spectroscopic imaging grid and the locations of five representative spectra. The labeled resonances are: choline (Ch), creatine (Cr), glutamine (Gln), glutamate (Glu), N-acetyl aspartate (NAA) and macromolecules (MM).

References

    1. Vaughan JT, Garwood M, Collins CM, Liu W, DelaBarre L, Adriany G, Andersen P, Merkle H, Goebel R, Smith MB, Ugurbil K. 7T vs. 4T: RF power, homogeneity, and signal-to-noise comparison in head images. Magn Reson Med. 2001;46(1):24–30. - PubMed
    1. Robitaille PM, Abduljalil AM, Kangarlu A, Zhang X, Yu Y, Burgess R, Bair S, Noa P, Yang L, Zhu H, Palmer B, Jiang Z, Chakeres DM, Spigos D. Human magnetic resonance imaging at 8 T. NMR Biomed. 1998;11(6):263–265. - PubMed
    1. Balchandani P, Pauly J, Spielman D. Interleaved narrow-band PRESS sequence with adiabatic spatial-spectral refocusing pulses for 1H MRSI at 7T. Magn Reson Med. 2008;59(5):973–979. - PMC - PubMed
    1. Balchandani P, Spielman D. Fat suppression for 1H MRSI at 7T using spectrally selective adiabatic inversion recovery. Magn Reson Med. 2008;59(5):980–988. - PMC - PubMed
    1. Scheenen TW, Heerschap A, Klomp DW. Towards 1H-MRSI of the human brain at 7T with slice-selective adiabatic refocusing pulses. MAGMA. 2008;21(1–2):95–101. - PMC - PubMed

Publication types

Substances