. 2009 Nov:Chapter 11:11.1.1-11.1.46.
doi: 10.1002/0471142735.im1101s87.

Phosphoinositide and inositol phosphate analysis in lymphocyte activation

Affiliations

Phosphoinositide and inositol phosphate analysis in lymphocyte activation

Karsten Sauer et al. Curr Protoc Immunol. 2009 Nov.

Abstract

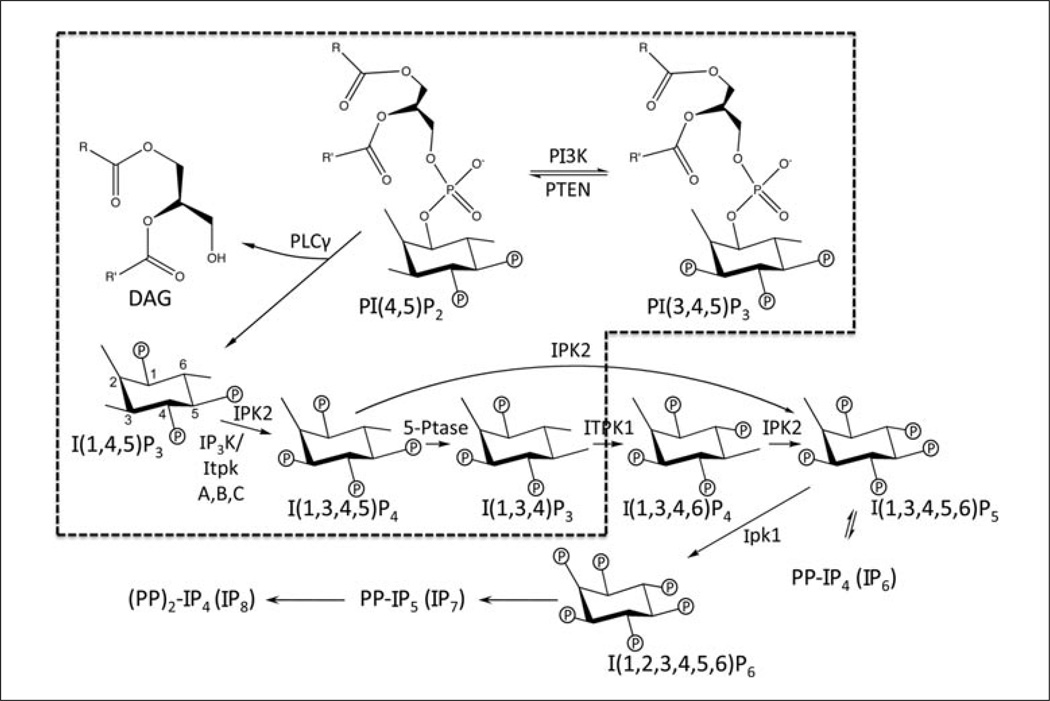
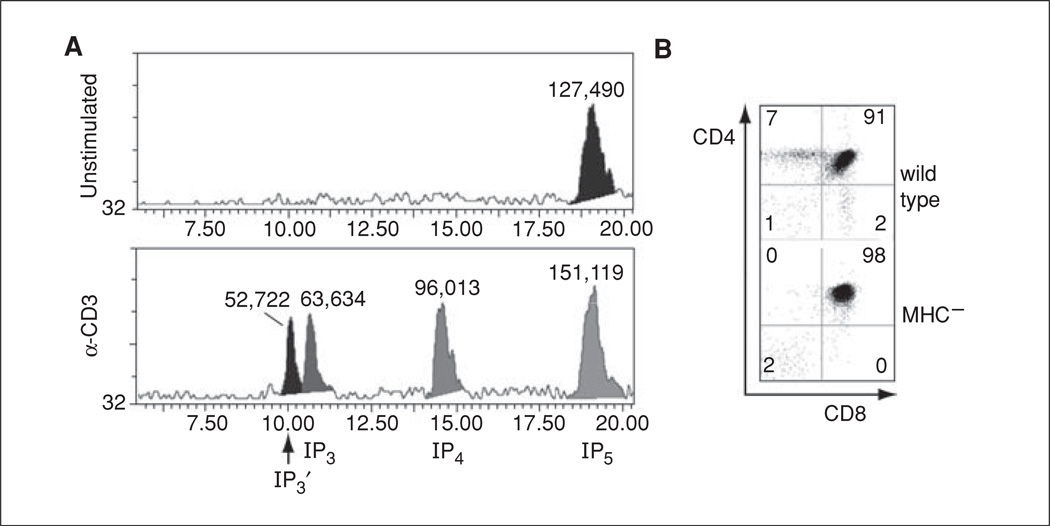
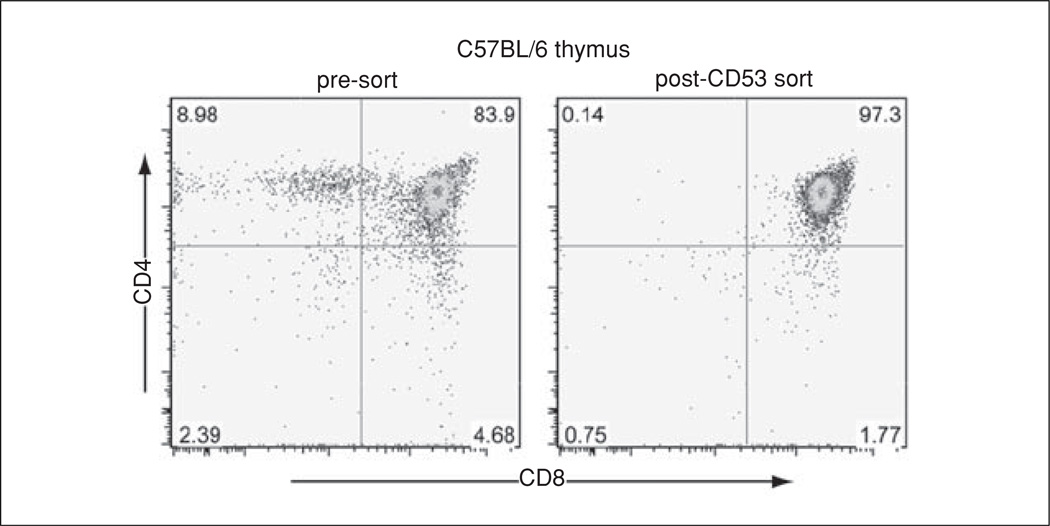
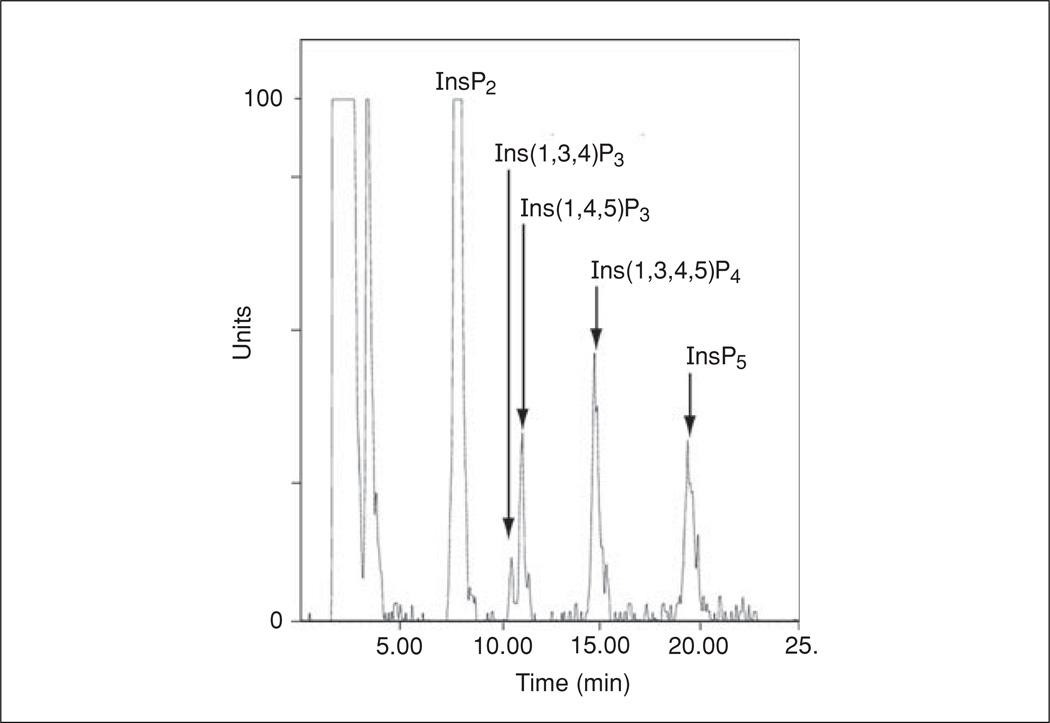
Lymphocyte antigen receptor engagement profoundly changes the cellular content of phosphoinositide lipids and soluble inositol phosphates. Among these, the phosphoinositides phosphatidylinositol 4,5-bisphosphate (PIP2) and phosphatidylinositol 3,4,5-trisphosphate (PIP3) play key signaling roles by acting as pleckstrin homology (PH) domain ligands that recruit signaling proteins to the plasma membrane. Moreover, PIP2 acts as a precursor for the second messenger molecules diacylglycerol and soluble inositol 1,4,5-trisphosphate (IP3), essential mediators of PKC, Ras/Erk, and Ca2+ signaling in lymphocytes. IP3 phosphorylation by IP3 3-kinases generates inositol 1,3,4,5-tetrakisphosphate (IP4), an essential soluble regulator of PH domain binding to PIP3 in developing T cells. Besides PIP2, PIP3, IP3, and IP4, lymphocytes produce multiple other phosphoinositides and soluble inositol phosphates that could have important physiological functions. To aid their analysis, detailed protocols that allow one to simultaneously measure the levels of multiple different phosphoinositide or inositol phosphate isomers in lymphocytes are provided here. They are based on thin layer, conventional and high-performance liquid chromatographic separation methods followed by radiolabeling or non-radioactive metal-dye detection. Finally, less broadly applicable non-chromatographic methods for detection of specific phosphoinositide or inositol phosphate isomers are discussed. Support protocols describe how to obtain pure unstimulated CD4+CD8+ thymocyte populations for analyses of inositol phosphate turnover during positive and negative selection, key steps in T cell development.


Figures

Figure 11.1.1
Figure 11.1.1
Mammalian inositol phosphate metabolism. Simplified scheme of the known inositol phosphate metabolic pathway in mammalian cells. Circled P, phosphate moiety; R, R’, fatty acid side chains. The hatched box encloses pathway components for which genetic data suggest relevance in lymphocytes. For more details and discussions of the enzymes involved and of potential cellular inositol phosphate functions, see previously published works (Irvine, 2001, 2005, 2007; Irvine and Schell, 2001; Irvine et al., 2006; Rusten and Stenmark, 2006; Otto et al., 2007; Seeds et al., 2007; Miller et al., 2008; Alcazar-Roman and Wente, 2008; Huang et al., 2008; Lin et al., 2009). The membrane phospholipid phosphatidylinositol 4,5-bisphosphate (PtdIns(4,5)P2/PI(4,5)P2, PIP2) acts as a precursor for the phosphoinositide PI(3,4,5)P3 (PIP3), and for the second messenger molecules diacylglycerol (DAG) and inositol 1,4,5-trisphosphate (Ins(1,4,5)P3/I(1,4,5)P3/IP3). In mammalian cells, I(1,4,5)P3 acts as a key precursor for multiple higher order, soluble inositol phosphates. An important step in the synthesis of several inositol phosphates is I(1,4,5)P3 phosphorylation into I(1,3,4,5)P4 (IP4) by either one of three IP3 3-kinases (IP3KA, B or C, also termed ItpkA, B, or C; Pouillon et al., 2003; Wen et al., 2004; Huang et al., 2007) or by IPK2/IPMK (Irvine, 2005; Irvine et al., 2006; Otto et al., 2007). Multiple higher order inositol phosphates have been reported in lymphocytes, including several of those shown here. The levels of some inositol phosphates are modulated after antigen receptor engagement (Imboden and Stobo, 1985; Stewart et al., 1986, 1987; Imboden and Pattison, 1987; Zilberman et al., 1987; Guse and Emmrich, 1991, 1992; Guse et al., 1992, 1993; Pouillon et al., 2003). Complementing known PIP3, IP3, and DAG functions in lymphocyte development and function (Starr et al., 2003; Fruman, 2004; Cante-Barrett et al., 2006; Jodi et al., 2008; Juntilla and Koretzky, 2008), it has been recently found that IP4 is essential for these processes through novel roles in antigen receptor signaling and myelopoiesis (Pouillon et al., 2003; Wen et al., 2004; Huang et al., 2007, 2008; Jia et al., 2007, 2008; Marechal et al., 2007; Miller et al., 2007). The protocols described here are thus optimized for analyses of IP3 and IP4 isomers.
Figure 11.1.2
Figure 11.1.2
Analysis of TCR induced inositol phosphate production in MCHIMHCII thymocytes. (A) HPLC elution profiles of extracts from unstimulated or αCD3-stimulated MHC murine thymocytes. 2 × 10⁸ cells were labeled overnight with 40 µCi myo-[3H] inositol, the precursor for all IPs. At 5 min post-stimulation with medium or 5 µg αCD3 (2C11), cells were lysed in 100 µl of 3% PCA and loaded onto a Whatman cartridge Col SAX PRTSPHR 15-cm HPLC column. [3H] IP content in the eluates was monitored with an IN/US systems Bram-4 in-line β-detector. IP3 or IP4 retention times were determined by spiking [3H] IP3 or [3H] IP4 into unlabeled cell extracts (not shown). IP3′ represents Ins(1,3,4)P3, an IP3 isomer originating from IP4 metabolism (Pouillon et al., 2003). IP5 represents a pool of IP5 isomers (Pouillon et al., 2003). (B) MHC thymocytes contain ≥98% DP cells, shown by FACS analysis of CD4 and CD8 expression on total thymocytes from 6-week-old C57BL/6 wild type (wt) or MHCIMHCII (MHC) mice. The two-dimensional plots indicate CD4 (y-axis) or CD8 (x-axis) fluorescence intensity for individual cells (dots). The numbers indicate % cells in the respective quadrant.
Figure 11.1.3
Figure 11.1.3
Analysis of thymocyte populations pre- and post-anti-CD53 AB sort. Two-dimensional plots showing CD4 (y-axis) and CD8 (x-axis) fluorescence intensities for individual thymocytes (dots) from 6-week-old C57BL/6 mice before (pre-sort) or after (post-CD53 sort) depletion of CD53+ cells. The numbers indicate percent cells in the respective quadrant.
Figure 11.1.4
Figure 11.1.4
A sample trace obtained from Jurkat cells labeled with myo-[3H] inositol and stimulated for 5 min with OKT3 and αCD28 (1 µg/ml). The inositol phosphate isomers detected are indicated. The peaks corresponding to Ins(1,4,5)P3 and Ins(1,3,4,5)P4 were verified with [3H]-labeled purified standards (Perkin-Elmer).
Figure 11.1.5
Figure 11.1.5
MDD-HPLC analysis of phytic acid hydrolysis products. (A) Elution profile. Peak identities were determined by comparison with the retention times for external standards (not shown). Peak 1 (retention time of 6.77 min) contains IP2 isomers, peak 2 (10.9 min) contains I(1,3,4)P3 and I(1,4,5)P3, peak 3 (11.23 min) contains D/L-I(1,5,6)P3, peak 4 (11.89 min) contains I(4,5,6)P3, peak 5 (13.63 min) contains I(1,2,3,5)P4 and I(1,2,4,6)P4, peak 6 (13.79 min) contains I(1,2,3,4)P4 and I(1,3,4,6)P4, peak 7 (13.91 min) contains I(1,2,4,5)P4 and I(1,3,4,5)P4, peak 8 (14.41 min) contains I(1,2,5,6)P4, peak 9 (14.78 min) contains I(2,4,5,6)P4, peak 10 (15.31 min) contains I(1/3,4,5,6)P4, peak 11 (15.83 min) contains D/L I(1,2,3,4,6)P5, peak 12 (16.31 min) contains D/L I(1,2,3,4,3)P5, peak 13 (17.04 min) contains D/L I(1,2,4,5,6)P5, peak 14 (17.32 min) contains I(1,3,4,5,6)P5, and peak 15 (18.97 min) contains I(1,2,3,4,5,6)P6 (unhydrolyzed phytic acid). (B) Calibration curve obtained with known amounts of an IP6 external standard.
Figure 11.1.6
Figure 11.1.6
MDD-HPLC analysis of soluble inositol phosphate isomers in Jurkat T cells. The MDD-HPLC method has been applied in a number of studies to analyze IPs in cells and tissues, including human Jurkat T cells (Guse et al., 1995a). In the example shown here, soluble IPs were extracted from ~5 × 10⁷ unstimulated or 10 µg/ml OKT3-stimulated Jurkat T cells. (A) a, separation of an IP standard mixture containing 554 pmol I(1,4,5)P3 (peak 1), 43 pmol I(1,2,3,5)P4 (peak 2), 113 pmol I(1,3,4,6)P4 (peak 3), 217 pmol I(1,3,4,5)P4 (peak 4), 116 pmol I(1,4,5,6)P4 (peak 5), 300 pmol I(1,2,3,4,6)P5 (peak 6), 20 pmol I(1,2,4,5,6)P5 (peak 7), 415 pmol I(1,3,4,5,6)P5 (peak 8), 646 pmol IP6 (peak 9), and 215 pmol PP-IP5 (peak 10). b–e, samples from unstimulated (b), 3 (c), 6 (d), or 20 min (e) OKT3-stimulated Jurkat cells. (B) Quantified amounts of the indicated IPs in the Jurkat cell samples from A. *, p < 0.01, obtained via Student’s t-test.

References

    1. Adelt S, Plettenburg O, Stricker R, Reiser G, Altenbach HJ, Vogel G. Enzyme-assisted total synthesis of the optical antipodes d-myo-inositol 3,4,5-trisphosphate and d-myo-inositol 1,5,6-trisphosphate: Aspects of their structure-activity relationship to biologically active inositol phosphates. J. Med. Chem. 1999;42:1262–1273. - PubMed
    1. Alcazar-Roman AR, Wente SR. Inositol polyphosphates: A new frontier for regulating gene expression. Chromosoma. 2008;117:1–13. - PubMed
    1. Amaro R, Escalona A, Murillo M. HPLC with inductively coupled plasma optical emission spectrometric detection for the analysis of inositol phosphates. J. Chromatogr. Sci. 2004;42:491–494. - PubMed
    1. Andrews WV, Conn PM. Measurement of inositol phospholipid metabolites by one-dimensional thin-layer chromatography. Methods Enzymol. 1987;141:156–168. - PubMed
    1. Astoul E, Edmunds C, Cantrell DA, Ward SG. PI 3-K and T-cell activation: Limitations of T-leukemic cell lines as signaling models. Trends Immunol. 2001;22:490–496. - PubMed

Publication types