. 2009;20(4):197-232.
doi: 10.3109/09548980903314204.

A theory of the influence of eye movements on the refinement of direction selectivity in the cat's primary visual cortex

Affiliations

A theory of the influence of eye movements on the refinement of direction selectivity in the cat's primary visual cortex

Antonino Casile et al. Network. 2009.

Abstract

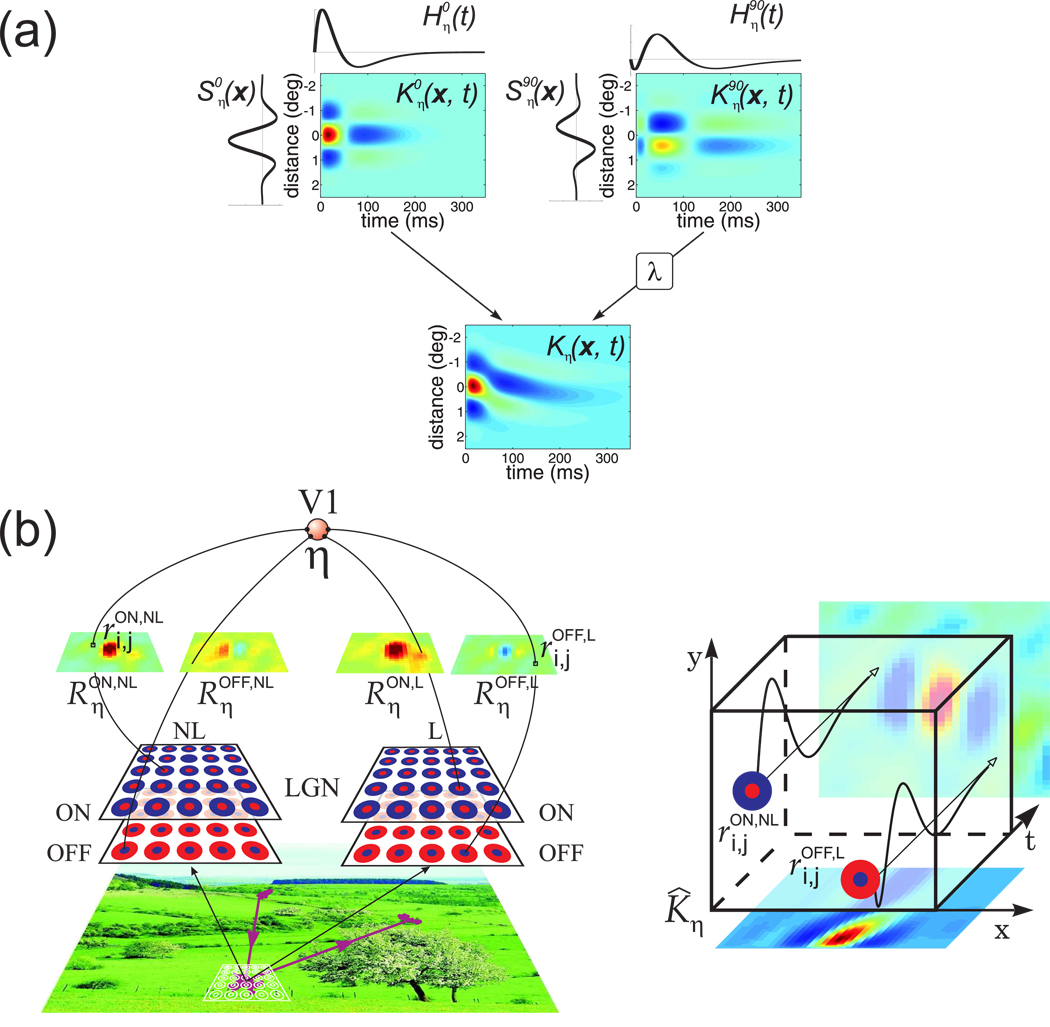
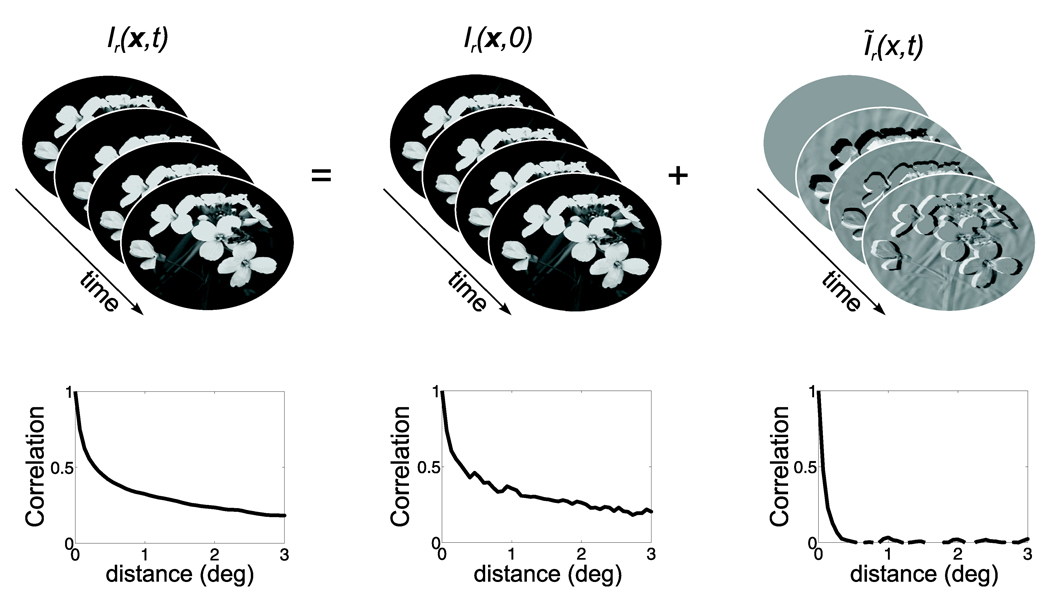
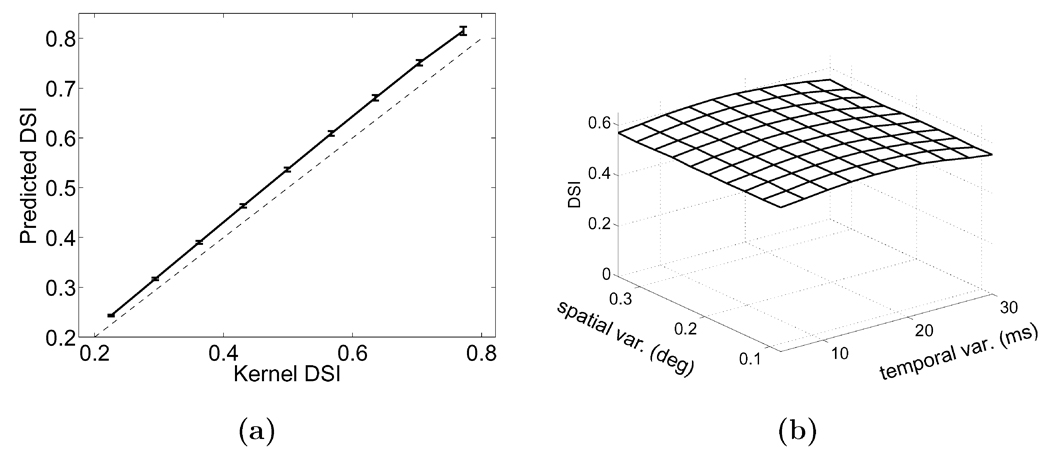
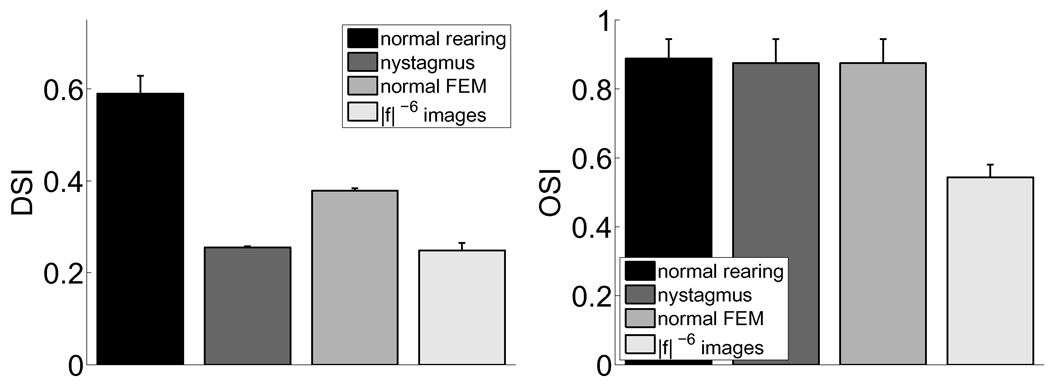
Early in life, visual experience influences the refinement of the preferential response for specific stimulus features exhibited by neurons in the primary visual cortex. A striking example of this influence is the reduction in cortical direction selectivity observed in cats reared under high-frequency stroboscopic illumination. Although various mechanisms have been proposed to explain the maturation of individual properties of neuronal responses, a unified account of the joint development of the multiple response features of cortical neurons has remained elusive. In this study, we show that Hebbian synaptic plasticity accounts for the simultaneous refinement of orientation and direction selectivity under both normal and stroboscopic rearing, if one takes into account the spatiotemporal input to the retina during oculomotor activity. In a computational model of the LGN and V1, eye movements are sufficient to establish the patterns of thalamocortical activity required for a Hebbian refinement of both direction- and orientation-selective responses during exposure to natural stimuli. Furthermore, we show that consideration of fixational eye movements explains the simultaneous loss of direction selectivity and preservation of orientation selectivity observed as a consequence of stroboscopic rearing. These results further support a role for oculomotor activity in the refinement of the response properties of V1 neurons.


Figures

Figure 1
Figure 1
Modeling approach. (a) Model of a V1 simple cell. The visually-evoked responses of V1 neurons were simulated by means of the sum of two space-time separable filters: Kη0(x,t) and Kη90(x,t) (see Eq. 2). (b) Procedure for estimating the impact of neural activity on Hebbian development. (Left) For each modeled V1 simple cell, η, levels of correlation were measured with the responses of four arrays of LGN units while sequences of simulated eye movements scanned images of natural scenes. Each array contained units with the same polarity p (ON- or OFF-center) and the same temporal dynamics d (non-lagged or lagged) and yielded a corresponding pattern of correlation ηp,d(x). The value ri,jp,d in each pattern represents the level of correlation between η and the LGN unit at location i, j in the array. (Right) The spatiotemporal kernel resulting from the structure of correlated activity, η(x, t) (the correlation kernel), was estimated as the linear combination of input contributions from all geniculate units, each geniculate input weighted by the unit’s average level of correlation r with η. This kernel was used to predict the direction of the developmental trajectory, i.e., whether the statistics of input stimulation would lead to a loss or enable preservation of the initial degree of selectivity exhibited by a V1 neuron. Note that a correlation kernel does not represent a prediction of the cell receptive field at the end of the critical period. The results of simulations in which synaptic changes were explicitly modeled are reported in Appendix B.
Figure 2
Figure 2
Influences of eye movements on the refinement of the receptive fields of V1 neurons. Results for five simulated simple cells are shown on separate rows. Column (a) shows spatiotemporal sections of the kernels of modeled units. (Kernel). Columns (b – d) show the kernels given by the structure of thalamocortical activity (the “correlation kernels”) measured in the following viewing conditions: during sustained fixation, when only fixational eye movements occurred (Fixation); during static presentation of visual stimulation (Static); and during sequences of eye movements that included only non-fixational saccades (Saccades). Sections were obtained by slicing the 3D kernels along the plane perpendicular to the cell’s preferred orientation. Black and gray lines in the kernels represent ON and OFF subregions, respectively. The values of the corresponding indices of orientation and direction selectivity are shown in each panel.
Figure 3
Figure 3
Structure of correlated activity for one cortical unit (Cell 1 in Fig. 2) in simulations of normal rearing. Results obtained during sustained fixation (Fixation) and during static exposure to visual stimulation (Static) are shown in (a) and (b), respectively. In both viewing conditions, panels are organized as follows: (Left column) Levels of correlation between the response of Cell 1 and those of line-arrays of non-lagged (NL, top) and lagged (L, bottom) LGN units. The receptive fields of geniculate neurons were centered at evenly-spaced locations on a line orthogonal to the preferred orientation of the V1 cell. This line cut in half the receptive field of the V1 neuron. At each spatial location on the x axis, levels of correlation with OFF-center units were subtracted from those with ON-center units. Thus, positive values in the curves indicate locations at which the V1 unit established stronger correlation with ON- rather than OFF-center LGN units. The opposite occurs for negative values. The spatial organizations of the two space-time separable components of Cell 1’s receptive field (Sη0 and λSη90 in Eq. 2) are also shown for comparison. (Center column) Contributions to the correlation kernel of Cell 1 from geniculate units with non-lagged (NL, top) and lagged dynamics (L, bottom). (Right column) Spatiotemporal sections of the two space-time separable components of Cell 1’s kernel (the terms Kη0(x,t) and λKη90(x,t) in Eq. 2).
Figure 4
Figure 4
An approximation of the retinal stimulus during fixational instability. At each instant in time t, the input signal Ir (x, t) impinging on the retina can be split into the sum of two images: a static image Ir(x, 0) representing the input at time t = 0 at retinal location x, and a time-varying image Ĩr(x, t), in which each pixel represents the instantaneous deviation of visual input with respect to Ir(x, 0): Ir(x, t) = Ir(x, 0) + Ĩr(x, t). Eq. 4 gives an approximation of the power spectrum of Ĩr. Each graph in the bottom row shows the average correlation in pixel intensity in the individual frames of the movie above. Spatial correlations are narrower in Ĩr(x, t) than in the original stimulus.
Figure 5
Figure 5
Characteristics of correlation kernels measured under various viewing conditions. The mean DSI and OSI of correlation kernels in simulations of normal rearing are compared to the corresponding values obtained: during viewing of natural images with large-amplitude nystagmus (nystagmus); during viewing of images with |f|−6 spectrum and normal fixational instability (|f|−6 images); and during presentation of spatial white noise (white noise). Data represent means ± s.e. over the set of 5 simulated units.
Figure 6
Figure 6
Robustness of results of normal rearing with respect to changes in model parameters. (a) Effect of varying the degree of space-time inseparability of modeled cortical units (parameter λ in Eq. 2). The mean DSI of correlation kernels is plotted as a function of the mean DSI of modeled neurons. Vertical bars represent standard errors over the 5 simulated units. (b) Effect of altering the statistics of fixational eye movements. Data points represent the mean DSI obtained in the presence of eye movements with varying degrees of amplitude and smoothness.
Figure 7
Figure 7
Correlation kernels measured in simulations of stroboscopic rearing. Visual input to the model replicated the retinal stimulus experienced by cats reared under 8-Hz stroboscopic illumination. Results for five simulated V1 units are shown on separate rows. Sections of modeled receptive fields (Kernel) are compared to equivalent sections of the correlations kernels (Correlation). Both spatiotemporal (left) and spatial (right) sections are shown. Spatiotemporal sections were obtained by slicing the 3D kernels at time t = 40 ms. Highly similar results were obtained for different values of t.
Figure 8
Figure 8
Structure of correlated activity for one cortical unit (Cell 1 in Fig. 2) in simulations of stroboscopic rearing. The layout of the panels is the same as in Fig. 3. (Left column) Levels of correlation between the response of Cell 1 and those of line-arrays of non-lagged (NL, top) and lagged (L, bottom) LGN units, respectively. At each spatial location on the x axis, levels of correlation with OFF-center units were subtracted from those with ON-center units, so that positive (negative) values indicate that the V1 unit was more (less) strongly correlated with ON- rather than OFF-center LGN units. The spatial organizations of the two space-time separable components of Cell 1’s receptive field (Sη0 and Sη90 in Eq. 2) are shown for comparison. (Center column) Contributions to the correlation kernel of Cell 1 from geniculate units with non-lagged (NL, top) and lagged dynamics (L, bottom). (Right column) Spatiotemporal sections of the two space-time separable components of Cell 1’s kernel (the terms Kη0(x,t) and λKη90(x,t) in Eq. 2).
Figure 9
Figure 9
Characteristics of correlation kernels measured under various conditions of stroboscopic rearing. The mean DSI and OSI measured during normal rearing are compared to those obtained in the presence of stroboscopic flashes and (1) small-amplitude nystagmus (nystagmus); (2) normal fixational eye movements (normal FEM); (3) visual input with |f|−6 spectral density and nystagmus (|f|−6 images). Data represent means ± s.e. over the set of 5 simulated units.
Figure 10
Figure 10
Robustness of the results of stroboscopic rearing. (a) Impact of the degree of space-time inseparability of modeled cortical units (the parameter λ in Eq. 2). The mean DSI of correlation kernels is plotted as a function of the mean DSI of simulated receptive fields. Error bars represent s.e. (b) Impact of the characteristics of nystagmus. Data points represent the mean DSI measured with nystagmus with different amplitudes and frequencies.
Figure 11
Figure 11
Comparison between the correlation kernels measured in simulations of the full model (solid line) and those given by the mathematical analysis of a linearized version of the model described in Appendix A (dashed line). Panels shows levels of correlation between Cell 1 in Fig. 2 and line arrays of non-lagged (left) and lagged LGN units (right) during normal (top row) and stroboscopic rearing (bottom row). The x-axis represents space relative to the center of the cortical receptive field. The similarity between analytical predictions and simulation results shown here for Cell 1 was also found for all the other V1 neurons in the model.
Figure 12
Figure 12
Results from simulations of synaptic plasticity. The two rows show results obtained when natural images were examined in the presence (Normal Fixation, top row) and in the absence of fixational eye movements (Static Fixation bottom row), respectively. (a,c) Temporal evolution of mean DSI and OSI ± s.e. measured across the five modeled cortical units. The two horizontal lines represent the mean DSI (solid line) and OSI (dashed line) at the time of eye opening. ((b,d)) Structure of the receptive field of Cell 1 in Fig. 2. The two panels in each figure show cross-sections of the two spatial components Sη0 and λSη90 in Eq. 2. Solid and dashed curves denote profiles measured at the beginning and at the end of the period of synaptic plasticity (see Appendix B for details).

Similar articles

Cited by

References

    1. Adelson EH, Bergen JR. Spatiotemporal energy models for the perception of motion. J Opt Soc Am A. 1985;2(2):284–299. - PubMed
    1. Albus K, Wolf W. Early post-natal development of neuronal function in the kitten’s visual cortex: A laminar analysis. J Physiol. 1984;348:153–185. - PMC - PubMed
    1. Alonso JM, Usrey WM, Reid RC. Rules of connectivity between geniculate cells and simple cells in cat primary visual cortex. J Neurosci. 2001;21(11):4002–4015. - PMC - PubMed
    1. Bienenstock EL, Cooper LN, Munro PW. Theory for the development of neuron selectivity: orientation specificity and binocular interaction in visual cortex. J Neurosci. 1982;2(1):32–48. - PMC - PubMed
    1. Blais B, Cooper LN, Shouval H. Formation of direction selectivity in natural scene environments. Neural Comput. 2000;12(5):1057–1066. - PubMed

Publication types

LinkOut - more resources