. 2010 Jan 25;218(1-2):73-82.
doi: 10.1016/j.jneuroim.2009.10.008. Epub 2009 Nov 17.

Circulating brain-reactive autoantibodies and behavioral deficits in the MRL model of CNS lupus

Affiliations

Circulating brain-reactive autoantibodies and behavioral deficits in the MRL model of CNS lupus

S Williams et al. J Neuroimmunol. .

Abstract

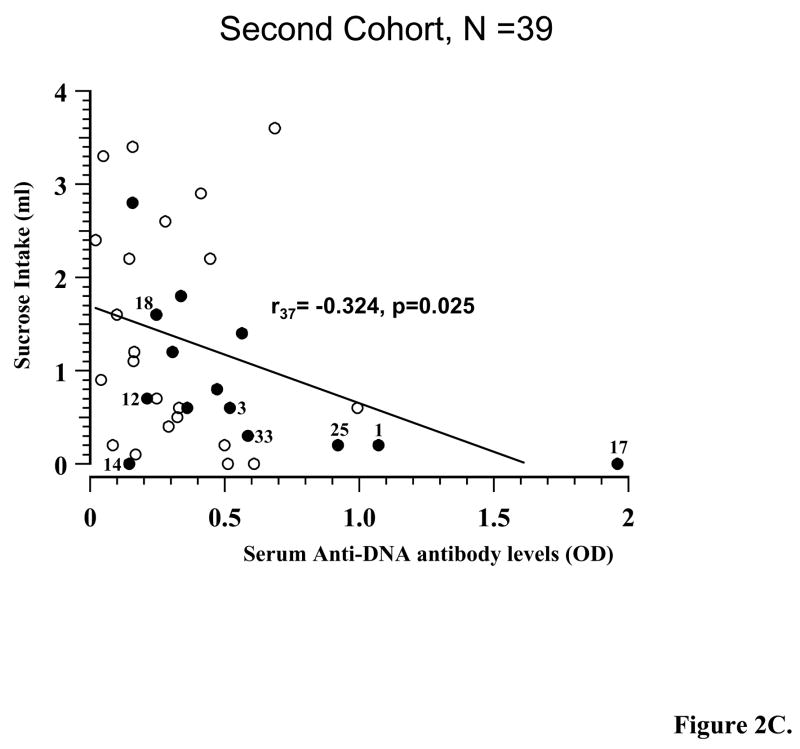
Brain-reactive autoantibodies (BRAA) are hypothesized to play a role in the neuropsychiatric manifestations that accompany systemic lupus erythematosus (SLE). The present study tests the proposed relation between circulating BRAA and behavioral deficits in lupus-prone MRL/lpr mice. Two age-matched cohorts born at different times were used to test the relationship in the context of altered disease severity. Significant correlations between autoimmunity and behavior were detected in both cohorts. These results are the first to report correlations between behavior and autoantibodies to integral membrane proteins of brain, supporting the hypothesis that BRAA contribute to the behavioral dysfunction seen in lupus.


Figures

Figure 1
Figure 1
Differences in spleen weight, anti-DNA autoantibody and BRAA levels between the first (N = 14) and second cohorts (N = 40) confirmed a production year-dependent decline in autoimmune phenotype. The mean +/− 2 standard errors of the mean are shown. The serum dilutions shown were at 1:400 for the anti-DNA autoantibodies, and 1:25 for the first cohort and 1:20 for the second cohort BRAA. There were statistically significant differences between the groups (** p = 0.01, *** p = 0.001).
Figure 2
Figure 2
Figure 2A. Negative correlation between performance in the sucrose test and serum BRAA levels (1:25 dilution), suggesting that decreased 4% sucrose consumption is associated with high levels of serum BRAA (r29=−0.348, p=0.041). This figure shows data from the mice in the first cohort. Figure 2B. Positive correlation between performance in the forced swim test and serum BRAA levels (1:80 dilution), suggesting that increased immobility is associated with high levels of serum BRAA (r38=0.463, p=0.002). This figure shows data from the mice in the second cohort. Solid symbols denote mice whose sera were used for Western blotting and immunohistochemistry. Figure 2C. Negative correlation between performance in the sucrose test and serum anti-DNA antibody levels (1:400 dilution), suggesting that decreased 4% sucrose consumption is associated with high levels of serum anti-DNA antibodies (r37= −0.324, p=0.025). This figure shows data from the mice in the second cohort. Solid symbols denote mice whose sera were used for Western blotting and immunohistochemistry.
Figure 2
Figure 2
Figure 2A. Negative correlation between performance in the sucrose test and serum BRAA levels (1:25 dilution), suggesting that decreased 4% sucrose consumption is associated with high levels of serum BRAA (r29=−0.348, p=0.041). This figure shows data from the mice in the first cohort. Figure 2B. Positive correlation between performance in the forced swim test and serum BRAA levels (1:80 dilution), suggesting that increased immobility is associated with high levels of serum BRAA (r38=0.463, p=0.002). This figure shows data from the mice in the second cohort. Solid symbols denote mice whose sera were used for Western blotting and immunohistochemistry. Figure 2C. Negative correlation between performance in the sucrose test and serum anti-DNA antibody levels (1:400 dilution), suggesting that decreased 4% sucrose consumption is associated with high levels of serum anti-DNA antibodies (r37= −0.324, p=0.025). This figure shows data from the mice in the second cohort. Solid symbols denote mice whose sera were used for Western blotting and immunohistochemistry.
Figure 3
Figure 3
Representative Western blots of MRL-lpr sera (A–D), corresponding to high or moderate float time animals 1, 17, 25 and low float time animal 3 (see figure 2B, from the second cohort), reactive with integral membrane proteins from brain of a non-autoimmune mouse. Different brain antigens were detected and their number or specificity did not match serum BRAA levels measured by ELISA. (Also see Table 4.)
Figure 4
Figure 4
Representative images showing binding between serum BRAA and brain sections from healthy C3H/HeJ mice by immunohistochemistry. The green fluorescence (FITC) shows antibody - antigen binding, while the red color shows propidium iodide (PI) staining of the cell nucleus which allows for easier identification of brain structures. Dual staining with PI and FITC is shown in figures B, D, F and H, i.e., all the figures on the right in figure 4. Figures A, C, E and G show the BRAA green fluorescence only, using FITC, i.e., all the figures on the left in figure 4. (A) Hippocampus and cortex showing only green fluorescence after exposure to serum from MRL-lpr mouse #1. (B) Hippocampus and cortex showing both green and red fluorescence after exposure to serum from MRL-lpr mouse #1. The combination staining appears as yellowish/green. (C) Lack of binding in the hippocampus and cortex using a serum from a non-autoimmune C3H/HeJ mouse with green fluorencence only. No staining indicates no BRAA binding. (D) Red and green fluorescence showing binding in the hippocampus and cortex using a serum from a non-autoimmune C3H/HeJ mouse. Only the red PI staining appears, indicating lack of BRAA binding. (E) Green fluorescence in the cortex only, obtained with serum from MRL-lpr mouse #33. (F) Green and red fluorescence in the cortex only, obtained with serum from MRL-lpr mouse #33. (G) Green fluorescence in the hippocampus only, obtained with the serum sample from MRL-lpr mouse #18. (H) Green and red fluorescence in the hippocampus only, obtained with the serum sample from MRL-lpr mouse #18. Abbreviations: CA, hippocampal regions; AuD, secondary auditory cortex, dorsal area; V2L, secondary visual cortex, lateral part.
Figure 4
Figure 4
Representative images showing binding between serum BRAA and brain sections from healthy C3H/HeJ mice by immunohistochemistry. The green fluorescence (FITC) shows antibody - antigen binding, while the red color shows propidium iodide (PI) staining of the cell nucleus which allows for easier identification of brain structures. Dual staining with PI and FITC is shown in figures B, D, F and H, i.e., all the figures on the right in figure 4. Figures A, C, E and G show the BRAA green fluorescence only, using FITC, i.e., all the figures on the left in figure 4. (A) Hippocampus and cortex showing only green fluorescence after exposure to serum from MRL-lpr mouse #1. (B) Hippocampus and cortex showing both green and red fluorescence after exposure to serum from MRL-lpr mouse #1. The combination staining appears as yellowish/green. (C) Lack of binding in the hippocampus and cortex using a serum from a non-autoimmune C3H/HeJ mouse with green fluorencence only. No staining indicates no BRAA binding. (D) Red and green fluorescence showing binding in the hippocampus and cortex using a serum from a non-autoimmune C3H/HeJ mouse. Only the red PI staining appears, indicating lack of BRAA binding. (E) Green fluorescence in the cortex only, obtained with serum from MRL-lpr mouse #33. (F) Green and red fluorescence in the cortex only, obtained with serum from MRL-lpr mouse #33. (G) Green fluorescence in the hippocampus only, obtained with the serum sample from MRL-lpr mouse #18. (H) Green and red fluorescence in the hippocampus only, obtained with the serum sample from MRL-lpr mouse #18. Abbreviations: CA, hippocampal regions; AuD, secondary auditory cortex, dorsal area; V2L, secondary visual cortex, lateral part.

Similar articles

Cited by

References

    1. Abbott NJ, Mendonca LL, Dolman DE. The blood-brain barrier in systemic lupus erythematosus. Lupus. 2003;12:908–915. - PubMed
    1. Alexander JJ, Jacob A, Vezina P, Sekine H, Gilkeson GS, Quigg RJ. Absence of functional alternative complement pathway alleviates lupus cerebritis. Eur J Immunol. 2007;37:1691–1701. - PubMed
    1. Aotsuka S, Okawa M, Ikebe K, Yokohari R. Measurement of anti-double stranded DNA antibodies in major immunoglobulin classes. J Immunol Methods. 1979;28:149–162. - PubMed
    1. Ballok DA, Ma X, Denburg JA, Arsenault L, Sakic B. Ibuprofen fails to prevent brain pathology in a model of neuropsychiatric lupus. J Rheumatol. 2006;33:2199–2213. - PMC - PubMed
    1. Ballok DA, Millward JM, Sakic B. Neurodegeneration in autoimmune MRL-lpr mice as revealed by Fluoro Jade B staining. Brain Res. 2003;964:200–210. - PubMed

Publication types