. 2009 Dec 1;15(23):7175-85.
doi: 10.1158/1078-0432.CCR-09-1938. Epub 2009 Nov 17.

Therapeutic potential of adult bone marrow-derived mesenchymal stem cells in prostate cancer bone metastasis

Affiliations

Therapeutic potential of adult bone marrow-derived mesenchymal stem cells in prostate cancer bone metastasis

Diptiman Chanda et al. Clin Cancer Res. .

Abstract

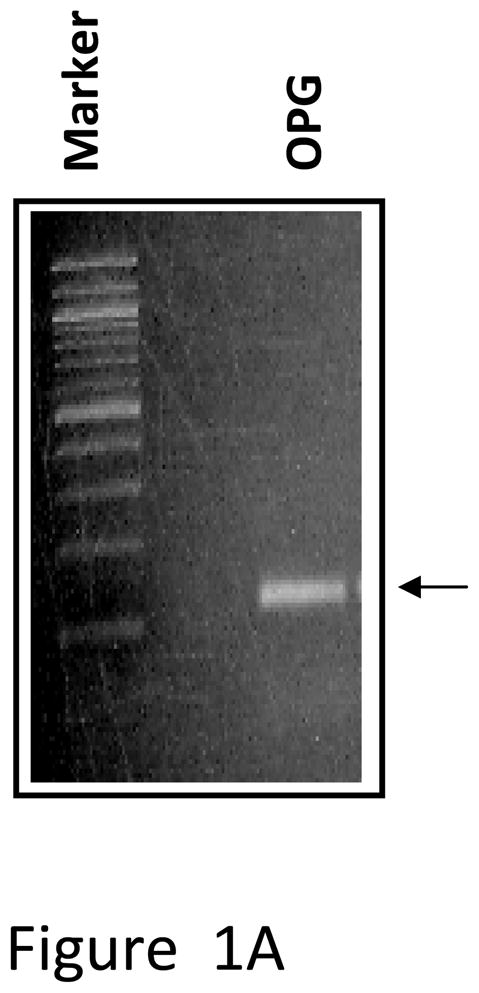
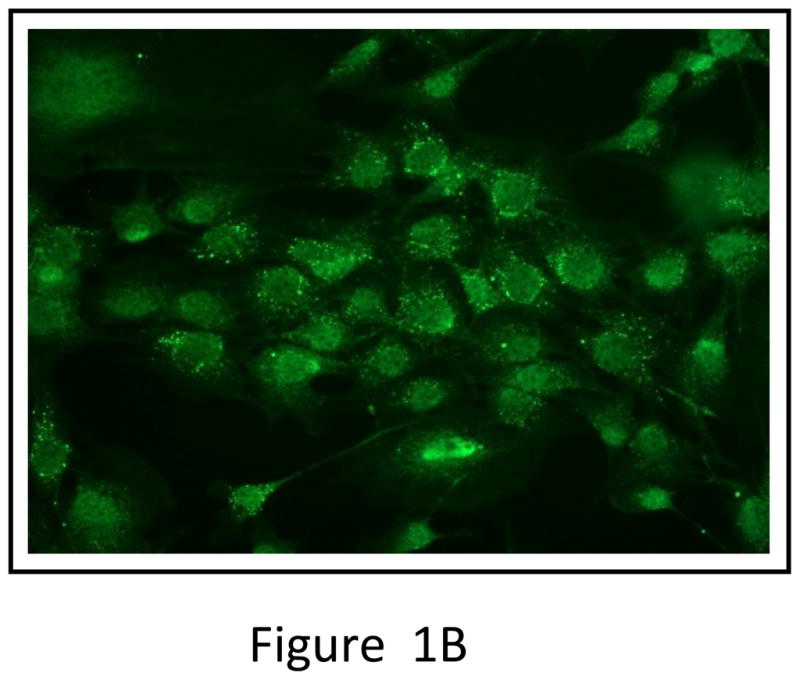
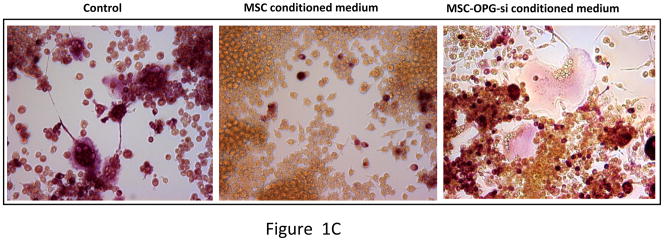
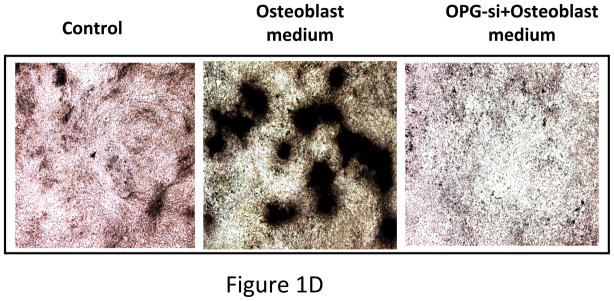
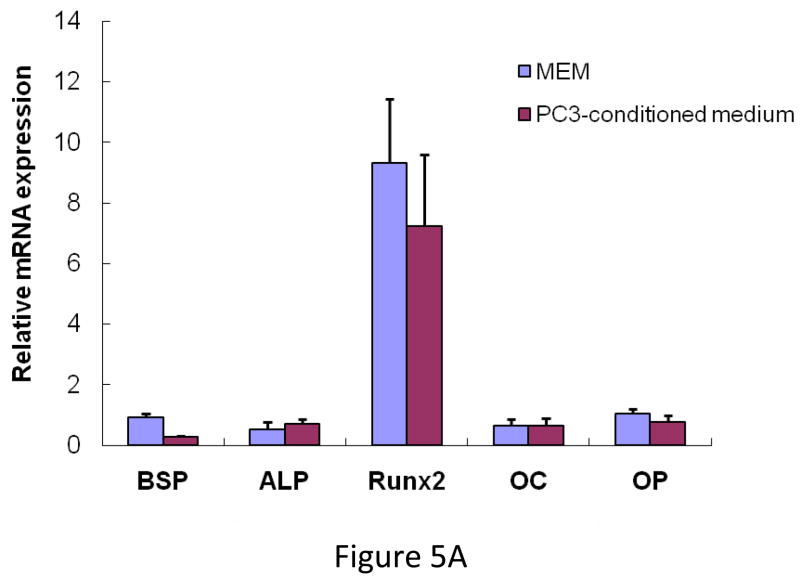
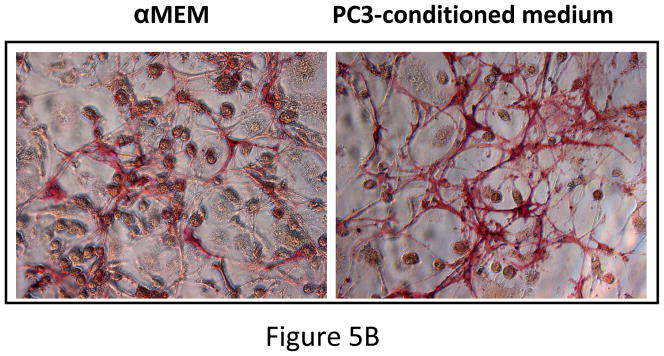
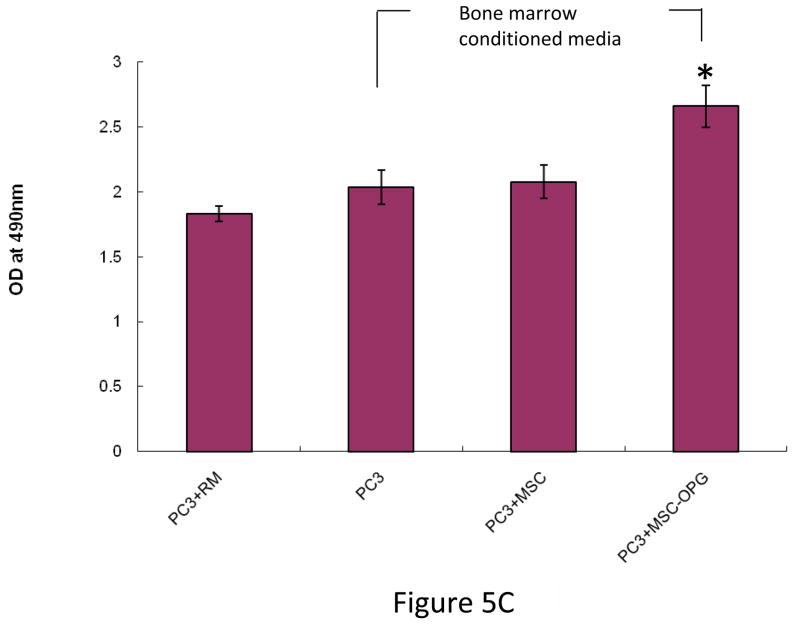
Purpose: Current evidence indicates that an osteoblast lesion in prostate cancer is preceded by osteolysis. Thus, prevention of osteolysis would reduce complications of bone metastasis. Bone marrow-derived mesenchymal stem cells have the ability to differentiate into osteoblast and produce osteoprotegerin, a decoy receptor for the receptor activator for nuclear factor kappaB ligand, naturally. The present study examined the potential of unmodified mesenchymal stem cells to prevent osteolytic bone lesions in a preclinical mouse model of prostate cancer.

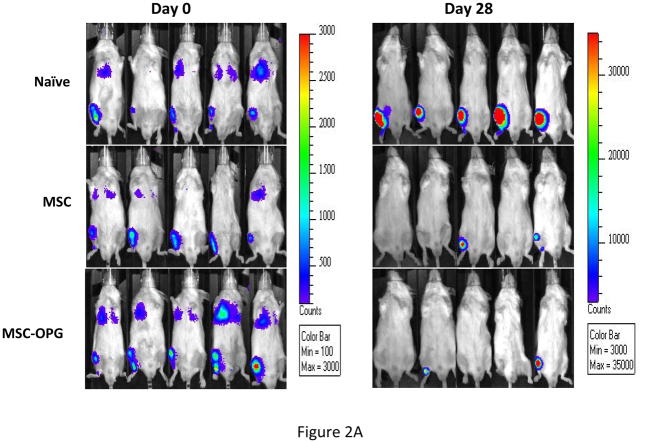
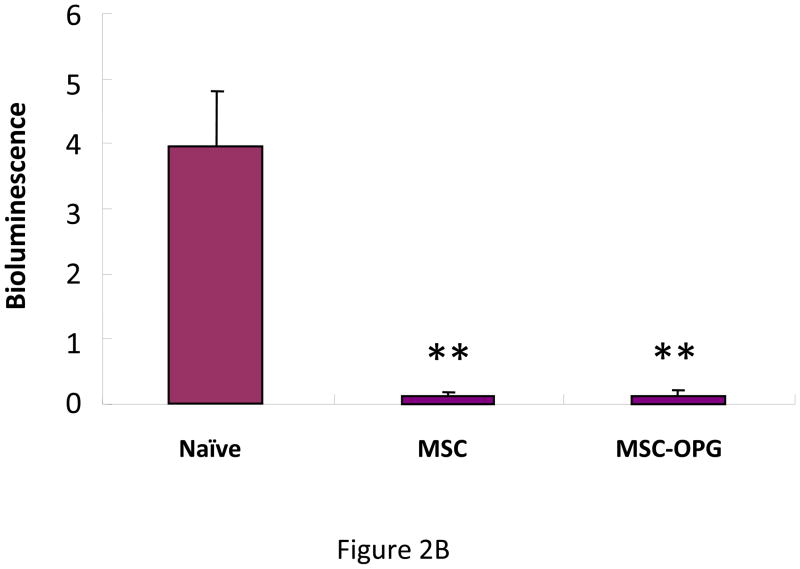
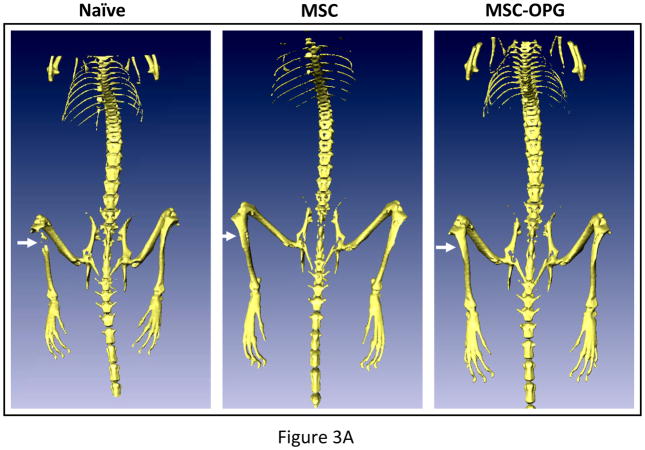
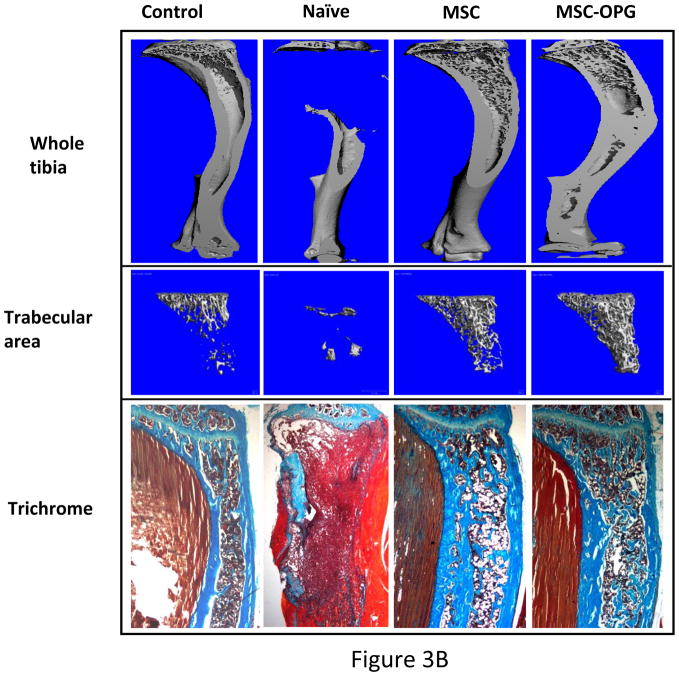
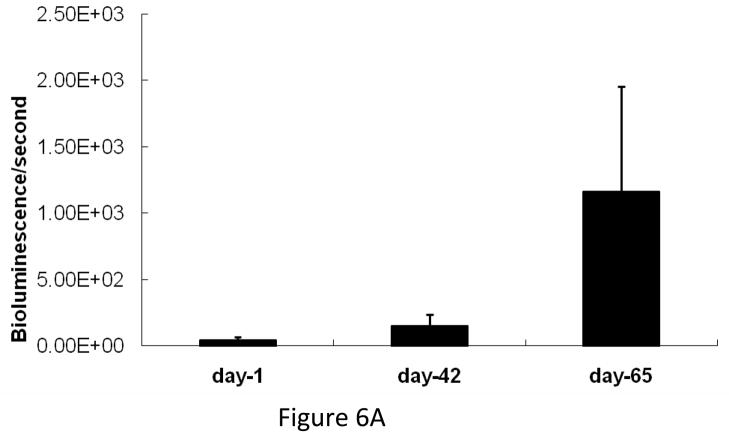
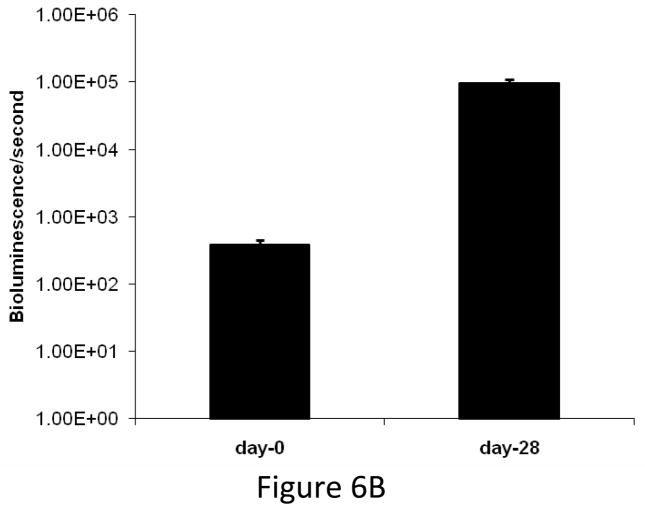
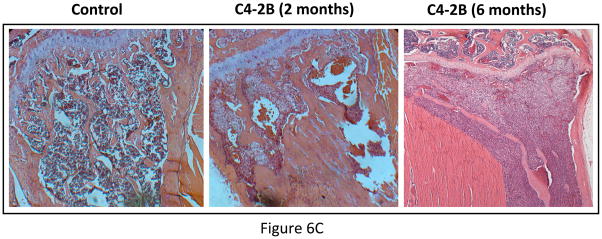
Experimental design: The human prostate cancer cell line PC3 was implanted in tibiae of severe combined immunodeficient mice. After establishment of the tumor, either unmodified or genetically engineered mesenchymal stem cells overexpressing osteoprotegerin was injected at the site of tumor growth. The effects of therapy were monitored by bioluminescence imaging, micro-computed tomography, immunohistochemistry, and histomorphometry.

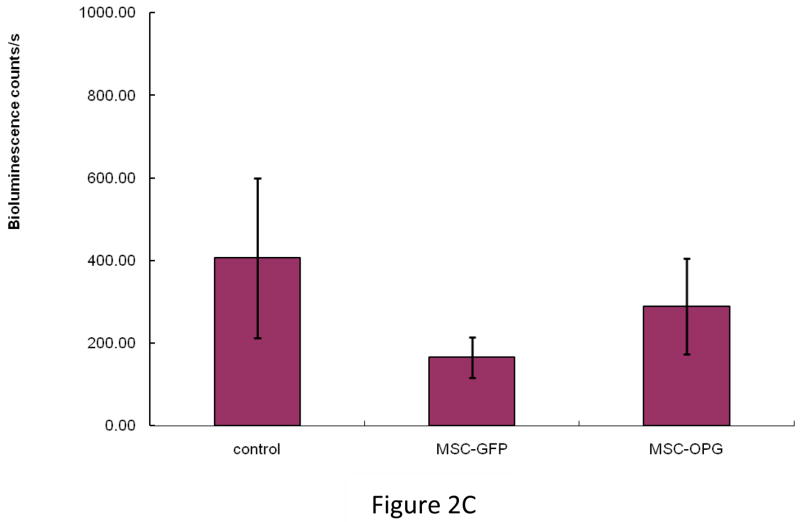
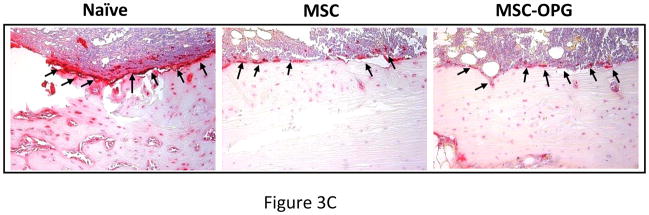
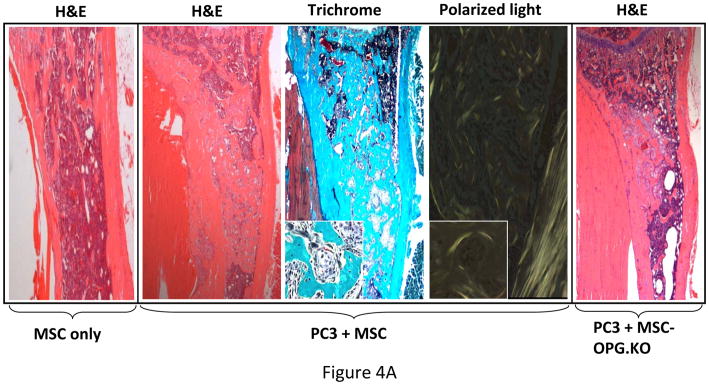
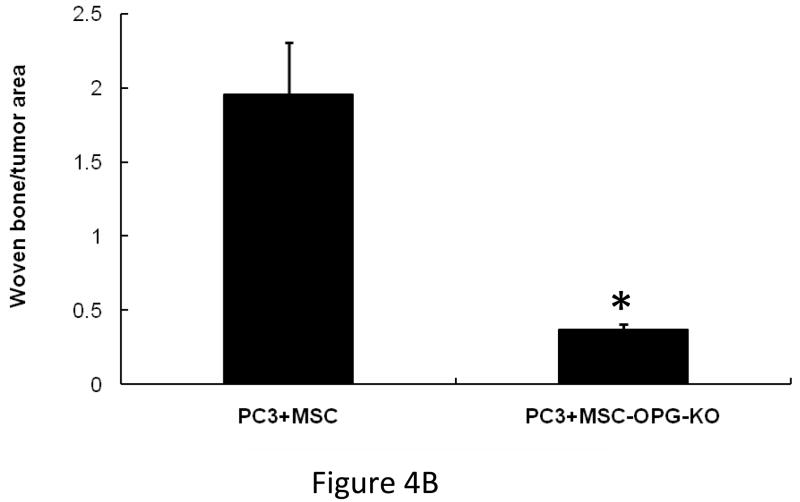
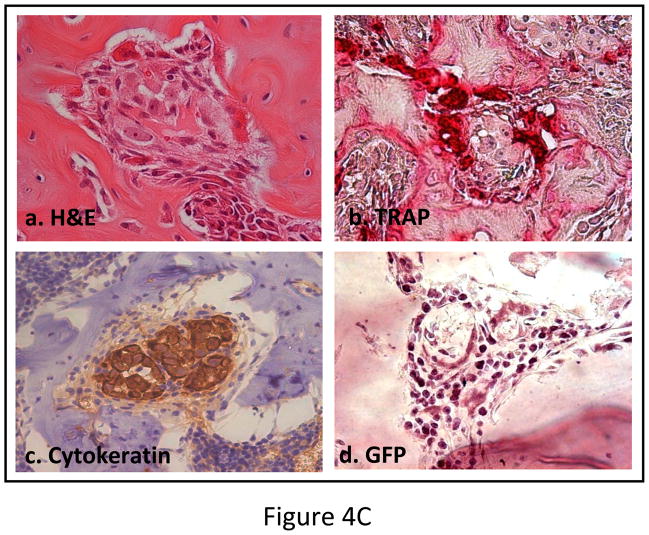
Results: Data indicated significant (P < 0.001) inhibition of tumor growth and restoration of bone in mice treated with unmodified and modified mesenchymal stem cells. Detailed analysis suggested that the donor mesenchymal stem cell inhibited tumor progression by producing woven bone around the growing tumor cells in the tibiae and by preventing osteoclastogenesis.

Conclusions: Overcoming the limitation of the number of mesenchymal stem cells available in the bone can provide significant amelioration for osteolytic damage without further modification.


Figures

Figure 1
Figure 1. Expression of OPG by MSC and its effects on osteoclast formation in vitro
(A) RT-PCR analysis showing OPG mRNA expression in unmodified mouse MSC. (B) Immunocytochemical localization of OPG in cultured mouse MSC. (C) Pre-osteoclast RAW cells were cultured in MSC conditioned medium in the presence of RANKL for 7 days. TRAP staining indicated inhibition of osteoclastogenesis in RAW cells grown in MSC conditioned medium compared to RAW cells grown in regular medium in the presence of RANKL. Conditioned medium from OPG-silenced MSC (OPG-KO-MSC) failed to prevent osteoclast formation. TRAP, Tartrate resistant acid phosphatase; RM, regular media; CM, conditioned media. (D) Control MSC and OPG-KO-MSC were tested for differentiation into osteoblast lineage using osteoblast medium for 2 weeks. Von Kossa staining was performed to detect calcium deposits (black) to confirm that osteoblast lineage differentiation is compromised in OPG-KO-MSC (right panel) as compared to unmodified MSC (middle panel). There was no positive staining in MSC culture without the osteoblast medium (left panel).
Figure 2
Figure 2. Tumor growth following MSC therapy
Non-invasive total body imaging was performed on the day of intra-tibial injection of PC3 cells (day 0) and 4 weeks after the intra-tibial administration of the MSC. (A) Mice represented in the left panel are the same mice that are represented in the right panel and they maintain the same order of alignment. (B) Quantitative analysis of luciferase expression as a measure of tumor growth, 4 weeks after the treatment with MSC or MSC modified to over-express OPG (**P<0.001). (C) When tumor cells were allowed to grow for 2 weeks followed by administration of MSC, therapeutic benefits are apparent but not statistically significant (P>0.05).
Figure 3
Figure 3. Histomorphometric analysis of bone
(A) 3-dimensional scanning μCT of the mouse skeleton showing restoration of tibia following MSC therapy compared to untreated mice. (B) 3-dimensional transmission μCT of the bone showing significant osteolysis in the tibia due to the growth of PC3 cells, whereas MSC and MSC over-expressing OPG therapy prevented osteolysis and reduced tumor burden significantly. When compared to normal tibia, both the treated groups demonstrated higher relative bone volume and trabecular bone density. MSC over-expressing OPG treated mice showed the highest bone volume and trabecular density. This is likely due to higher inhibition of osteoclastogenesis. Sections of tibia stained with Goldner’s trichrome stain, where mineralized bone stains blue-green as shown in the bottom panel (Original magnification ×25). (C) Reduction of osteoclast activity following treatment as determined by TRAP staining. Both MSC and MSC over-expressing OPG demonstrated significantly less osteoclast activity at the tumor-bone interface (arrowheads) as compared to untreated mice. (Original magnification ×200)
Figure 4
Figure 4. Mechanism of tumor inhibition following implantation of MSC in tibiae with PC3 tumors
(A) Histomorphology of tibia showing presence or absence of new bone formation surrounding tumor nests in mice tibiae following implantation of unmodified MSC only, or following PC3 tumor cell implantation. Polarized light microscopy showing the newly formed bone, composed of randomly-oriented, mineralized collagen fibers (woven bone) (Original magnification ×100). When MSC were implanted into a normal tibia without the tumor cells, no such bone formation was observed (far left panel). When PC3 cells were injected in the tibia followed by implantation of MSC (OPG silenced) similarly no significant bone formation (far right panel) was observed suggesting the requirement of OPG for in vivo bone formation. (B) Graph showing the amount of woven bone formed in the tibia after treatment with MSC, OPG-KO-MSC or MSC-OPG. OPG-KO-MSC resulted in least amount of woven bone (*P<0.001) indicating a requirement for simultaneous inhibition of osteoclastogenesis while MSC differentiate into bone. (C) Hematoxylin and eosin (H&E) staining of the tibia showing spindle-like cells of mesenchymal origin bordering the tumor and the new bone (a). Significant osteoclast activity was noticed by TRAP staining at the tumor-bone interface most likely serving as the initiating factor for the MSC differentiation into osteoblasts (b). Immunostaining with the human epithelial marker cytokeratin 18 indicated tumor nests surrounded by the MSC (c). Staining with GFP antibody confirmed that differentiating MSC are of donor origin (d) (Original magnification ×20).
Figure 5
Figure 5. Expression of osteogenic genes
(A) MSC were cultured for 10 days in either regular medium or PC3 conditioned medium. Total RNA was isolated, converted to cDNA and analyzed for up-regulation of osteogenic genes. Data showing no significant change in osteoblastic lineage differentiation after MSC were cultured in conditioned media obtained from PC3 cells. BSP, bone sialoprotein; ALP, alkaline phosphatase; Run×2, runt-related transcription factor; OC, osteocalcin; OP, osteopontin (B) MSC cultured in regular medium or PC3 conditioned medium showing equivalent alkaline phosphatase activity, indicating that PC3 cells did not initiate osteoblastic differentiation in the MSC directly. (C) PC3-MSC in vitro co-culture assay. PC3 cells were grown on hu-biogel matrix as 3D spheroids and cultured in a 0.8μm pore size transwell plate along with MSC in the lower chamber. After 72 hours the PC3 beads were collected and analyzed by MTT assay for cell proliferation. Data presented here are Mean±SEM (n=12 for each experimental conditions).
Figure 6
Figure 6
(A) Growth kinetics of osteoblastic C4-2B cells in the tibia of SCID mice. (B) Growth kinetics of PC3 cells in the tibia of SCID mice. (C) C4-2B injected tibia showing osteolytic lesions when allowed to grow for 6 months.
Figure 6
Figure 6
(A) Growth kinetics of osteoblastic C4-2B cells in the tibia of SCID mice. (B) Growth kinetics of PC3 cells in the tibia of SCID mice. (C) C4-2B injected tibia showing osteolytic lesions when allowed to grow for 6 months.
Figure 6
Figure 6
(A) Growth kinetics of osteoblastic C4-2B cells in the tibia of SCID mice. (B) Growth kinetics of PC3 cells in the tibia of SCID mice. (C) C4-2B injected tibia showing osteolytic lesions when allowed to grow for 6 months.

Similar articles

Cited by

References

    1. Jemal A, Siegel R, Ward E, Murray T, Xu H, Thun MJ. Cancer statistics. CA Cancer J Clin. 2007;57:43–66. - PubMed
    1. Roudier MP, Morrissey C, True LD, Higano CS, Vessella RL, Ott SM. Histopathological assessment of prostate cancer bone osteoblastic metastases. J Urol. 2008;180:1154–60. - PMC - PubMed
    1. Ye L, Kynaston HG, Jiang WG. Bone metastasis in prostate cancer: molecular and cellular mechanisms. Int J Mol Med. 2007;20:103–11. - PubMed
    1. Guise TA, Yin JJ, Mohammad KS. Role of endothelin-1 in osteoblastic bone metastases. Cancer. 2003;97:779–84. - PubMed
    1. Choueiri MB, Tu SM, Yu-Lee LY, Lin SH. The central role of osteoblasts in the metastasis of prostate cancer. Cancer Metastasis Rev. 2006;25:601–9. - PubMed

Publication types

Substances