

Troponin regulatory function and dynamics revealed by H/D exchange-mass spectrometry
- PMID: 19920153
- PMCID: PMC2807325
- DOI: 10.1074/jbc.M109.062349
Troponin regulatory function and dynamics revealed by H/D exchange-mass spectrometry
Abstract
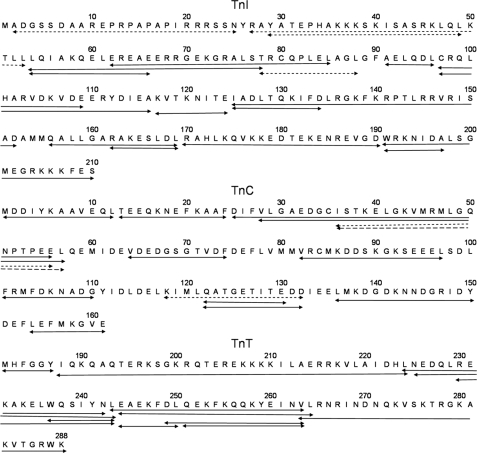
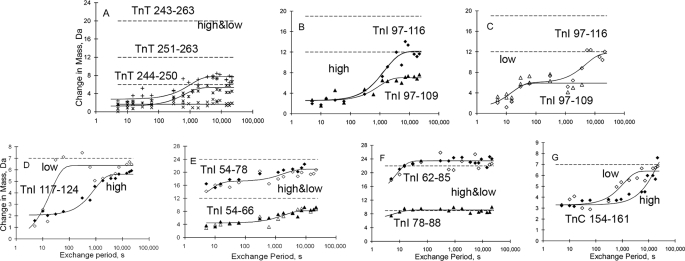
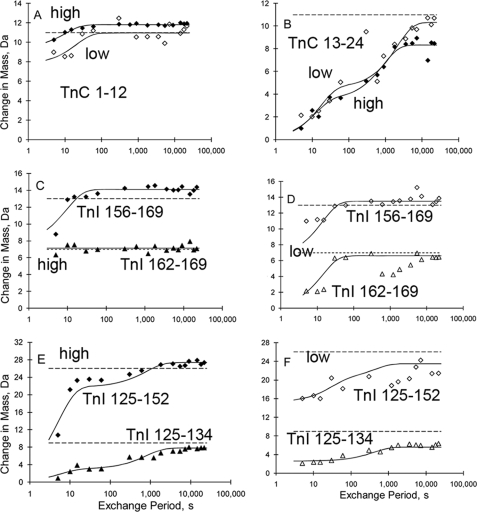
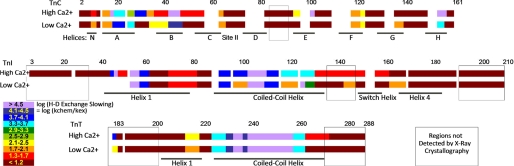
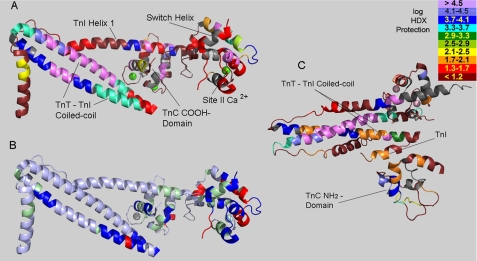
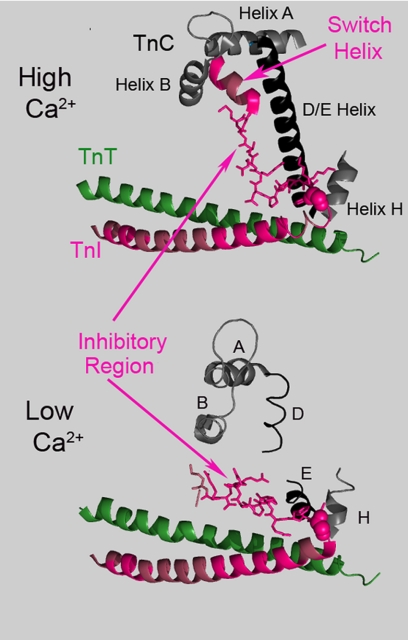
Muscle contraction is tightly regulated by Ca(2+) binding to the thin filament protein troponin. The mechanism of this regulation was investigated by detailed mapping of the dynamic properties of cardiac troponin using amide hydrogen exchange-mass spectrometry. Results were obtained in the presence of either saturation or non-saturation of the regulatory Ca(2+) binding site in the NH(2) domain of subunit TnC. Troponin was found to be highly dynamic, with 60% of amides exchanging H for D within seconds of exposure to D(2)O. In contrast, portions of the TnT-TnI coiled-coil exhibited high protection from exchange, despite 6 h in D(2)O. The data indicate that the most stable portion of the trimeric troponin complex is the coiled-coil. Regulatory site Ca(2+) binding altered dynamic properties (i.e. H/D exchange protection) locally, near the binding site and in the TnI switch helix that attaches to the Ca(2+)-saturated TnC NH(2) domain. More notably, Ca(2+) also altered the dynamic properties of other parts of troponin: the TnI inhibitory peptide region that binds to actin, the TnT-TnI coiled-coil, and the TnC COOH domain that contains the regulatory Ca(2+) sites in many invertebrate as opposed to vertebrate troponins. Mapping of these affected regions onto the troponin highly extended structure suggests that cardiac troponin switches between alternative sets of intramolecular interactions, similar to previous intermediate resolution x-ray data of skeletal muscle troponin.
Figures
Similar articles
-
Significance of troponin dynamics for Ca2+-mediated regulation of contraction and inherited cardiomyopathy.J Biol Chem. 2012 Dec 7;287(50):42299-311. doi: 10.1074/jbc.M112.423459. Epub 2012 Oct 12. J Biol Chem. 2012. PMID: 23066014 Free PMC article.
-
Structure of the core domain of human cardiac troponin in the Ca(2+)-saturated form.Nature. 2003 Jul 3;424(6944):35-41. doi: 10.1038/nature01780. Nature. 2003. PMID: 12840750
-
Low temperature dynamic mapping reveals unexpected order and disorder in troponin.J Biol Chem. 2010 Dec 10;285(50):38978-86. doi: 10.1074/jbc.M110.181305. Epub 2010 Oct 2. J Biol Chem. 2010. PMID: 20889975 Free PMC article.
-
Structural interactions responsible for the assembly of the troponin complex on the muscle thin filament.Cell Struct Funct. 1997 Feb;22(1):219-23. doi: 10.1247/csf.22.219. Cell Struct Funct. 1997. PMID: 9113410 Review.
-
Invertebrate troponin: Insights into the evolution and regulation of striated muscle contraction.Arch Biochem Biophys. 2019 May 15;666:40-45. doi: 10.1016/j.abb.2019.03.013. Epub 2019 Mar 27. Arch Biochem Biophys. 2019. PMID: 30928296 Free PMC article. Review.
Cited by
-
Molecular effects of familial hypertrophic cardiomyopathy-related mutations in the TNT1 domain of cTnT.J Mol Biol. 2012 Aug 3;421(1):54-66. doi: 10.1016/j.jmb.2012.05.008. Epub 2012 May 10. J Mol Biol. 2012. PMID: 22579624 Free PMC article.
-
Cardiac Troponin and Tropomyosin: Structural and Cellular Perspectives to Unveil the Hypertrophic Cardiomyopathy Phenotype.Front Physiol. 2016 Sep 23;7:429. doi: 10.3389/fphys.2016.00429. eCollection 2016. Front Physiol. 2016. PMID: 27721798 Free PMC article. Review.
-
Complexation and Calcium-Induced Conformational Changes in the Cardiac Troponin Complex Monitored by Hydrogen/Deuterium Exchange and FT-ICR Mass Spectrometry.Int J Mass Spectrom. 2011 Apr 30;302(1-3):116-124. doi: 10.1016/j.ijms.2010.08.023. Int J Mass Spectrom. 2011. PMID: 21765647 Free PMC article.
-
The missing links within troponin.Arch Biochem Biophys. 2019 Mar 15;663:95-100. doi: 10.1016/j.abb.2018.12.026. Epub 2018 Dec 22. Arch Biochem Biophys. 2019. PMID: 30584890 Free PMC article. Review.
-
Molecular dynamics simulations of the cardiac troponin complex performed with FRET distances as restraints.PLoS One. 2014 Feb 18;9(2):e87135. doi: 10.1371/journal.pone.0087135. eCollection 2014. PLoS One. 2014. PMID: 24558365 Free PMC article.
References
Publication types
MeSH terms
Substances
Grants and funding
LinkOut - more resources
Full Text Sources
Miscellaneous
