. 2009 Nov 17;2(97):ra73.
doi: 10.1126/scisignal.2000431.

Tyrosine phosphorylation inhibits PKM2 to promote the Warburg effect and tumor growth

Affiliations

Tyrosine phosphorylation inhibits PKM2 to promote the Warburg effect and tumor growth

Taro Hitosugi et al. Sci Signal. .

Abstract

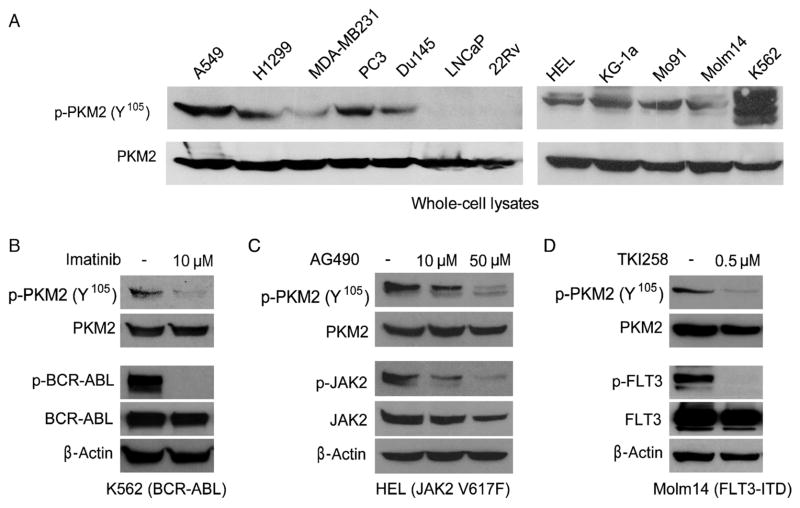
The Warburg effect describes a pro-oncogenic metabolism switch such that cancer cells take up more glucose than normal tissue and favor incomplete oxidation of glucose even in the presence of oxygen. To better understand how tyrosine kinase signaling, which is commonly increased in tumors, regulates the Warburg effect, we performed phosphoproteomic studies. We found that oncogenic forms of fibroblast growth factor receptor type 1 inhibit the pyruvate kinase M2 (PKM2) isoform by direct phosphorylation of PKM2 tyrosine residue 105 (Y(105)). This inhibits the formation of active, tetrameric PKM2 by disrupting binding of the PKM2 cofactor fructose-1,6-bisphosphate. Furthermore, we found that phosphorylation of PKM2 Y(105) is common in human cancers. The presence of a PKM2 mutant in which phenylalanine is substituted for Y(105) (Y105F) in cancer cells leads to decreased cell proliferation under hypoxic conditions, increased oxidative phosphorylation with reduced lactate production, and reduced tumor growth in xenografts in nude mice. Our findings suggest that tyrosine phosphorylation regulates PKM2 to provide a metabolic advantage to tumor cells, thereby promoting tumor growth.


Figures

Fig. 1
Fig. 1
PKM2 is tyrosine phosphorylated and inhibited by FGFR1 in cancer cells with oncogenic or overexpressed FGFR1. (A) Schematic representation of PKM2. The six phosphorylated tyrosine residues identified in the proteomics studies are indicated. (B) Immunoblotting (WB) of 293T cell lysates for tyrosine phosphorylation of GST-PKM2 when coexpressed with the constitutively active fusion protein 8p11 ZNF198-FGFR1 PR/TK or with FGFR1 in the presence and absence of FGFR1 ligand (bFGF). (C) FGFR1 wild type (WT) but not a kinase dead (KD) mutant inhibits PKM2 enzyme activity in 293T cells (*0.01 < P < 0.05; n.s., not significant). The error bars represent the means ± SD from three independent experiments. Relative PKM2 activity was normalized to that in control 293T cells. (D) Inhibition of FGFR1 by tyrosine kinase inhibitor TKI258 (1 μM for 2 hours) results in increased PKM2 enzyme activity in leukemia KG-1a (FOP2-FGFR1), breast cancer MDA-MB-134 (FGFR1), and lung cancer H1299 cells (FGFR1) (*0.01< P < 0.05; **P < 0.01). Relative PKM2 activity was normalized to that in control cells without TKI258 treatment.
Fig. 2
Fig. 2
FGFR1 inhibits PKM2 by phosphorylation at Y105. (A) Mutational analysis revealed that substitution of Y105 results in a significant increase in PKM2 activity in 293T cells (n.s., not significant; *P < 0.05). Relative enzyme activity was normalized to that of cells expressing GST-PKM2 WT. (B) Left: Immunoblotting (WB) shows shRNA-mediated stable knockdown of endogenous hPKM2 in H1299 cells by lentiviral transduction, and “rescue” expression of Flag-tagged mPKM2 proteins including WT, Y105F, and Y390F mutants. Right: Y105F has significantly higher catalytic activity than mPKM2 WT or Y390F in rescue H1299 cells. Relative catalytic activity was normalized to that of mPKM2 WT. (C) GST-PKM2 WT or Y105F mutant was incubated with active recombinant FGFR1 (rFGFR1) in an in vitro kinase assay. Phosphorylation at Y105 in PKM2 was detected by specific antibody p-PKM2 (Y105). (D) Immunoblotting revealed that inhibition of FGFR1 by TKI258 treatment in H1299 cells results in decreased Y105 phosphorylation of endogenous PKM2.
Fig. 3
Fig. 3
Y105 phosphorylation disrupts formation of active, tetrameric PKM2 by releasing cofactor FBP. (A) Incubation of a pY105 phosphopeptide attenuates the catalytic activity of FBP-loaded recombinant PKM2 (rPKM2). Relative PKM2 activity was normalized to rPKM2 without preincubation with FBP. The error bars represent the means ± SD from three independent experiments. (B) Incubation of phospho-Y105 peptide leads to reduced formation of tetrameric, active PKM2. rPKM2 (Myc-tagged) preincubated with FBP was incubated with each peptide, followed by 0.025% glutaraldehyde cross-linking (+) before SDS–polyacrylamide gel electrophoresis and Western blot analysis. Parallel samples without cross-linking treatment (−) were included as loading controls. The numbers represent the relative intensity of the specific bands of PKM2 tetramers, which are normalized to the value of control sample without treatment of peptide. (C) Phospho-Y105 peptide incubation results in release of FBP from PKM2. [14C]FBP was incubated with rPKM2 and the unbound FBP was dialysed away. [14C]FBP-soaked rPKM2 was incubated with the indicated peptides followed by dialysis to remove the unbound FBP peptides. Retained [14C]FBP on PKM2 was measured with a scintillation counter. (D) Inhibition of FGFR1 by TKI258 results in increased PKM2 enzyme activity in rescue H1299 cells expressing mPKM2 WT or Y390F mutant, but not in cells expressing mPKM2 Y105F and K433E mutants (*0.01 < P < 0.05; n.s., not significant). Relative PKM2 activity was normalized to WT cells without TKI258 treatment. (E) Phosphorylation of PKM2 at Y105 is detected by immunoblotting in rescue cells expressing mPKM2 WT, Y390F, or K433E mutants, but not in cells expressing the Y105F mutant.
Fig. 4
Fig. 4
PKM2 is specifically phosphorylated at Y105 in various cancer cell lines. (A) Immunoblotting detects Y105 phosphorylation of PKM2 in diverse lung cancer (A549, H1299), breast cancer (MDA-MB231), prostate cancer (PC3, Du145), and leukemia (HEL, KG-1a, Mo91, Molm14, K562) cell lines, but not in two prostate cancer cell lines, LNCaP and 22Rv. Immunoblotting shows that targeting BCR-ABL by imatinib in K562 cells (B), JAK2 by AG490 in HEL cells (C), and FLT3 by TKI258 in Molm14 cells (D) decreases phosphorylation of PKM2 Y105.
Fig. 5
Fig. 5
Expression of PKM2 Y105F mutant in H1299 cells leads to decreased proliferation under hypoxic conditions, increased oxidative phosphorylation and reduced tumor growth. (A) Rescue expression of mPKM2 Y105F in H1299 cells results in reduced cell proliferation under hypoxic conditions (1%) but not at normal oxygen tension (normoxic; 17% oxygen) compared with cells expressing PKM2 WT or Y390F mutant. Cell proliferation was determined by the increase in cell number 96 hours after seeding compared to that at seeding for each cell line (T = 0). Error bars represent the means ± SD from three independent experiments. (B) Y105F rescue H1299 cells have a higher rate of oxygen consumption than do cells with mPKM2 WT. (C) Y105F rescue H1299 cells show significantly reduced lactate production under normoxia. (D) Proliferation (left), oxygen consumption rate (middle), and intracellular ATP concentration (right) of Y105F rescue H1299 cells are significantly decreased relative to cells expressing PKM2 WT or the Y390F mutant when treated with oligomycin. (E) Upper left: Tumors (indicated by red arrows) in representative nude mice injected with mPKM2 WT H1299 cells on the left flank and mPKM2 Y105F H1299 cells on the right flank. Lower left: Dissected tumors from the depicted nude mice. Right: expression of Flag-tagged mPKM2 WT and Y105F detected by immunoblotting in injected rescue cells (upper) and tumor lysates (lower). Phosphorylation of PKM2 at Y105 was detected in tumors formed by cells expressing mPKM2 WT, but not in tumors derived from Y105F-expressing cells. (F) H1299 cells expressing PKM2 Y105F show significantly reduced tumor formation in xenograft nude mice (P value was determined by the paired Student’s t test).

Similar articles

Cited by

References

    1. Brahimi-Horn MC, Chiche J, Pouyssegur J. Hypoxia signalling controls metabolic demand. Curr Opin Cell Biol. 2007;19:223–229. - PubMed
    1. Kroemer G, Pouyssegur J. Tumor cell metabolism: Cancer’s Achilles’ heel. Cancer Cell. 2008;13:472–482. - PubMed
    1. Hanahan D, Weinberg RA. The hallmarks of cancer. Cell. 2000;100:57–70. - PubMed
    1. Hathurusinghe HR, Goonetilleke KS, Siriwardena AK. Current status of tumor M2 pyruvate kinase (tumor M2-PK) as a biomarker of gastrointestinal malignancy. Ann Surg Oncol. 2007;14:2714–2720. - PubMed
    1. Mazurek S, Boschek CB, Hugo F, Eigenbrodt E. Pyruvate kinase type M2 and its role in tumor growth and spreading. Semin Cancer Biol. 2005;15:300–308. - PubMed

Publication types

MeSH terms

LinkOut - more resources