. 2009 Dec;119(12):3787-96.
doi: 10.1172/JCI39724. Epub 2009 Nov 16.

alpha1G-dependent T-type Ca2+ current antagonizes cardiac hypertrophy through a NOS3-dependent mechanism in mice

Affiliations

alpha1G-dependent T-type Ca2+ current antagonizes cardiac hypertrophy through a NOS3-dependent mechanism in mice

Hiroyuki Nakayama et al. J Clin Invest. 2009 Dec.

Abstract

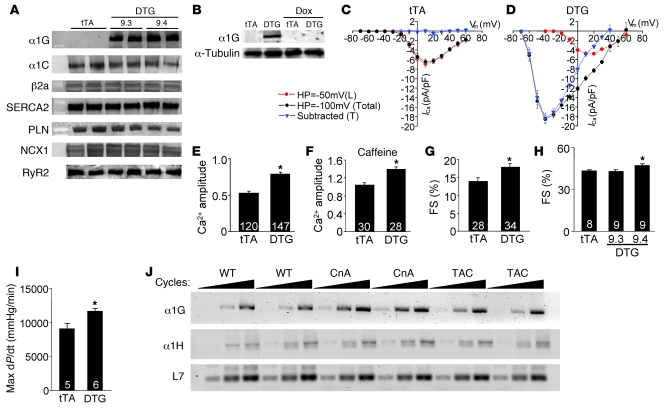
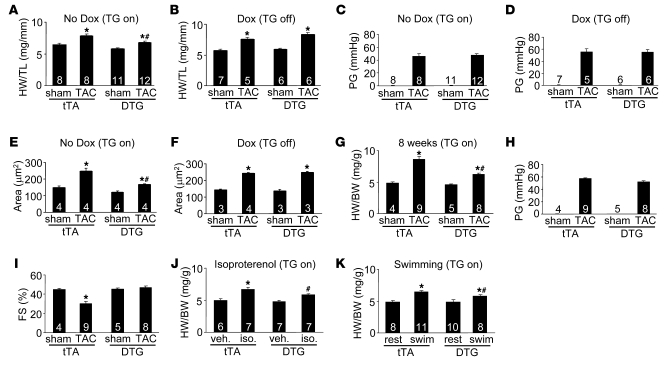
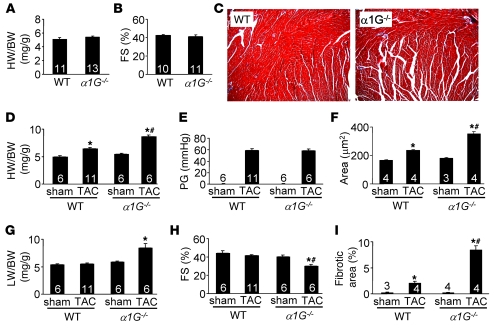
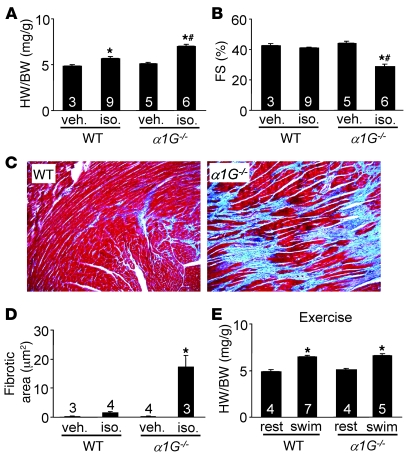
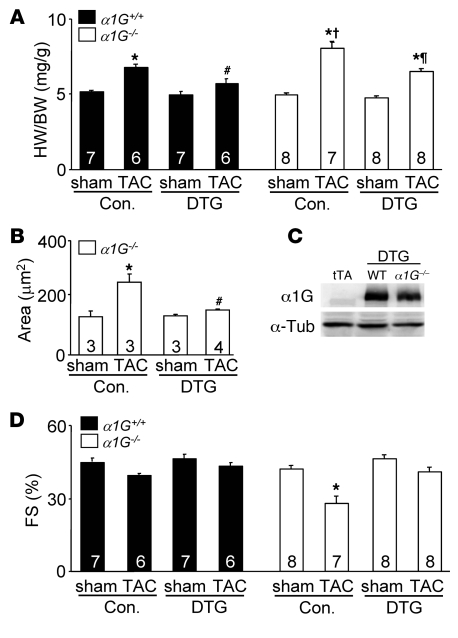
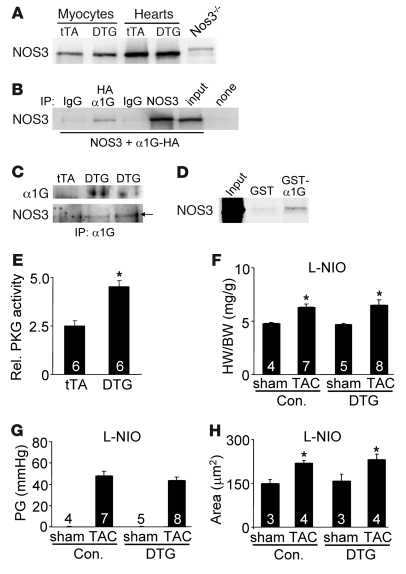
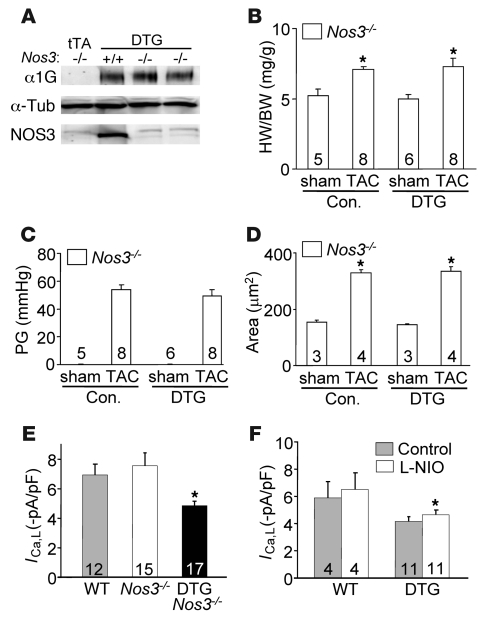
In noncontractile cells, increases in intracellular Ca2+ concentration serve as a second messenger to signal proliferation, differentiation, metabolism, motility, and cell death. Many of these Ca2+-dependent regulatory processes operate in cardiomyocytes, although it remains unclear how Ca2+ serves as a second messenger given the high Ca2+ concentrations that control contraction. T-type Ca2+ channels are reexpressed in adult ventricular myocytes during pathologic hypertrophy, although their physiologic function remains unknown. Here we generated cardiac-specific transgenic mice with inducible expression of alpha1G, which generates Cav3.1 current, to investigate whether this type of Ca2+ influx mechanism regulates the cardiac hypertrophic response. Unexpectedly, alpha1G transgenic mice showed no cardiac pathology despite large increases in Ca2+ influx, and they were even partially resistant to pressure overload-, isoproterenol-, and exercise-induced cardiac hypertrophy. Conversely, alpha1G-/- mice displayed enhanced hypertrophic responses following pressure overload or isoproterenol infusion. Enhanced hypertrophy and disease in alpha1G-/- mice was rescued with the alpha1G transgene, demonstrating a myocyte-autonomous requirement of alpha1G for protection. Mechanistically, alpha1G interacted with NOS3, which augmented cGMP-dependent protein kinase type I activity in alpha1G transgenic hearts after pressure overload. Further, the anti-hypertrophic effect of alpha1G overexpression was abrogated by a NOS3 inhibitor and by crossing the mice onto the Nos3-/- background. Thus, cardiac alpha1G reexpression and its associated pool of T-type Ca2+ antagonize cardiac hypertrophy through a NOS3-dependent signaling mechanism.


Figures

Figure 1
Figure 1. Generation of inducible transgenic mice with increased TTCC current.
(A) Western blot analysis of α1G subunit protein in 2 independent DTG lines (9.3 and 9.4) without Dox (induced state). Levels of α1C, β2a, SERCA2, PLN, NCX1, and RyR2 were unchanged. (B) Western blot showing inducible expression of α1G protein in line 9.4 DTG mice without Dox and its extinguishment by 3 weeks of Dox administration. (C and D) Current-voltage relationships measured with a holding potential (HP) of –50 mV and –100 mV in tTA (27 cells from 5 hearts) and DTG (30 cells from 5 hearts) adult ventricular cardiomyocytes (line 9.4). The blue triangles represent the subtracted difference as T-current. (E) Amplitude of Ca2+ transients from tTA (control) and DTG (line 9.4) cardiomyocytes. (F) SR Ca2+ content assessed by amplitude of Ca2+ with caffeine stimulation. (G) Assessment of adult myocyte fractional shortening (FS) after isolation from tTA and DTG (line 9.4) hearts. (H) Fractional shortening of whole hearts from tTA and DTG (both lines) mice by echocardiography. (I) Invasive hemodynamic measurement in tTA and DTG line 9.3 mice. (J) RT-PCR for α1G, α1H, and L7 (control) from hearts of mice that were WT, transgenic for the activated calcineurin mutant protein (CnA), or subjected to pressure overload by TAC. Increasing numbers of PCR cycles are designated by the triangles in J. The number in each bar indicates the number of measured cardiomyocytes or mice. *P < 0.05 vs. tTA control.
Figure 2
Figure 2. Targeted overexpression of α1G antagonizes cardiac hypertrophy after stress stimulation.
(A) Heart weight (HW) normalized to tibia length (TL) for tTA and DTG (line 9.4) mice 2 weeks after sham surgery or TAC without Dox (transgene induced). (B) HW/TL for tTA and DTG (line 9.4) mice 2 weeks after sham surgery or TAC with Dox (transgene inhibited). (C and D) Systolic pressure gradient (PG) across the aortic constriction in mice without Dox (induced) (C) or with Dox (inhibited) (D). (E and F) Histological analysis of myocyte cross-sectional areas from ventricles (of the indicated groups of mice 2 weeks after TAC without Dox (induced) (E) or with Dox (inhibited) (F). (G) HW normalized to BW for tTA and DTG (line 9.4) mice 8 weeks after TAC without Dox (induced). (H) Systolic pressure gradient across the aortic constriction from the mice in G. (I) Fractional shortening assessment by echocardiography from the mice in G. (J) HW/BW in the indicated groups of mice after 2 weeks of isoproterenol infusion or PBS (veh.) without Dox (induced). (K) HW/BW after 3 weeks of swimming in the indicated groups of mice without Dox (induced). rest, resting. The number of mice analyzed in each group is shown within the bars. *P < 0.05 versus sham/veh./rest in the same mouse group; #P < 0.05 versus tTA subjected to TAC/isoproterenol/swimming.
Figure 3
Figure 3. α1G deletion exacerbates cardiac hypertrophy 2 weeks after pressure overload.
(A) HW/BW ratio of α1G–/– or α1G+/+ (WT) mice at 10 weeks of age. (B) Fractional shortening assessment by echocardiography for α1G–/– or WT mice at 10 weeks of age. (C) Histological assessment (original magnification, ×100) of cellular pathology of α1G–/– or WT mice by Masson’s trichrome staining at 10 weeks of age. (D) HW/BW ratio of α1G–/– or WT mice 2 weeks after sham surgery or TAC. (E) Systolic pressure gradient across the aortic constriction assessed by Doppler echocardiography in mice from D. (F) Histological analysis of myocyte cross-sectional areas from ventricles of mice in D. (G) Lung weight (LW) normalized to BW of mice in D. (H) Fractional shortening assessed by echocardiography for mice in D. (I) Quantitation of fibrotic area (blue) from Masson’s trichrome–stained cardiac histological sections for mice in D. The number of mice analyzed in each group is shown within the bars. *P < 0.05 versus sham; #P < 0.05 versus WT TAC.
Figure 4
Figure 4. α1G deletion exacerbates cardiac pathology after isoproterenol infusion.
(A) HW/BW in α1G–/– or α1G+/+ (WT) mice infused with isoproterenol (iso.) at 60 mg/kg/d or PBS for 14 days. (B) Fractional shortening (FS) assessment by echocardiography from mice as in A. (C) Representative histological assessment (original magnification, ×100) of pathology from mice as in A. (D) Quantitation of fibrotic area (blue) from Masson’s trichrome–stained cardiac histological sections obtained from mice as in A. (E) HW/BW after 3 weeks of swimming exercise in the indicated groups of mice. The number of mice analyzed in each group is shown within the bars. *P < 0.05 versus WT veh./rest; #P < 0.05 versus WT iso.
Figure 5
Figure 5. Restoration of α1G in cardiomyocytes suppresses the pathologic phenotype of α1G–/– mice.
(A) HW/BW of α1G DTG (line 9.4) or control (WT and tTA) mice in the α1G–/– or α1G+/+ background 2 weeks after a sham or TAC procedure. (B) Histological analysis of myocyte cross-sectional areas from ventricles of α1G DTG (line 9.4) or control (Con.; WT and tTA) mice in the α1G–/– background 2 weeks after TAC. (C) Western blot analysis of α1G protein expression from α1G DTG (line 9.4) mice in the α1G–/– or α1G+/+ backgrounds at 3 months of age. α-Tub, α-tubulin. (D) Fractional shortening assessment by echocardiography from mice as in A. The number of mice analyzed in each group is shown within the bars. *P < 0.05 versus sham; #P < 0.05 versus control TAC in the α1G+/+ background; P < 0.05 versus control TAC in the α1G+/+ background; P < 0.05 versus control TAC in the α1G–/– background.
Figure 6
Figure 6. NOS3 is involved downstream of α1G.
(A) Western blot analysis for NOS3 expression from isolated adult cardiomyocytes or whole hearts of tTA or DTG (line 9.4) mice. A Nos3–/– heart sample is shown as a negative control. (B) Western blot for NOS3 after immunoprecipitation for HA-tagged α1G and associated NOS3 after transient transfection into HEK293 cells. “None” indicates input from HEK cells transfected with an HA-encoding empty vector. (C) Immunoprecipitation from tTA or DTG hearts that were subjected to pressure overload. α1G antibody was used for the immunoprecipitation, followed by Western blotting for α1G and NOS3 protein. (D) Autoradiogram of [35S]NOS3 protein association with α1G using bacteria-generated GST or GST-α1G fusion protein. (E) PKGI activity assay from tTA and DTG hearts after pressure overload. Rel., relative. *P < 0.05 versus tTA. (F) HW/BW ratio of α1G DTG (line 9.4) and control (tTA and WT) mice 2 weeks after sham surgery or TAC with administration of L-NIO. (G) Systolic pressure gradient across the aortic constriction from mice as in F. (H) Histological analysis of myocyte cross-sectional areas from ventricles of mice in F. The number of mice analyzed in each group is shown within the bars. *P < 0.05 versus sham control.
Figure 7
Figure 7. NOS3 ablation abolishes the anti-hypertrophic effect caused by α1G overexpression.
(A) Western blot analysis of α1G, α-tubulin (control), and NOS3 from α1G DTG (line 9.4) mice in the Nos3–/– or Nos3+/+ backgrounds at 3 months of age. (B) HW/BW in α1G DTG (line 9.4) and control (tTA and WT) mice in the Nos3–/– background 2 weeks after a sham or TAC procedure. (C) Systolic pressure gradient across the aortic constriction in mice from B. (D) Histological analysis of myocyte cross-sectional areas from ventricles of mice in B. The number of mice analyzed in each group is shown within the bars. *P < 0.05 versus sham control. (E) Peak L-type Ca2+ current of adult myocytes isolated from hearts of the indicated groups of mice. Values were collected at a holding potential of –40 mV and test potentials of +20 mV. Numbers in the bars represent the numbers of myocytes analyzed. *P < 0.05 versus WT. (F) Peak L-type Ca2+ current of adult myocytes isolated from hearts of the indicated groups of mice treated with or with out L-NIO. Numbers in the bars represent the numbers of myocytes analyzed. *P < 0.05 versus WT.

References

    1. Lorell B.H., Carabello B.A. Left ventricular hypertrophy: pathogenesis, detection, and prognosis. Circulation. 2000;102:470–479. - PubMed
    1. Ho K.K., Levy D., Kannel W.B., Pinsky J.L. The epidemiology of heart failure: The Framingham study. J. Am. Coll. Cardiol. 1993;22:6–13. - PubMed
    1. Lloyd-Jones D.M., et al. Lifetime risk for developing congestive heart failure: the Framingham Heart Study. Circulation. 2002;106:3068–3072. doi: 10.1161/01.CIR.0000039105.49749.6F. - DOI - PubMed
    1. Molkentin J.D. Dichotomy of Ca2+ in the heart: contraction versus intracellular signaling. . J. Clin. Invest. 2006;116:623–626. doi: 10.1172/JCI27824. - DOI - PMC - PubMed
    1. Wu X., et al. Local InsP3-dependent perinuclear Ca2+ signaling in cardiac myocyte excitation-transcription coupling. J. Clin. Invest. 2006;116:675–682. doi: 10.1172/JCI27374. - DOI - PMC - PubMed

Publication types

MeSH terms