. 2009:5:327.
doi: 10.1038/msb.2009.84. Epub 2009 Nov 17.

Dissection of a complex transcriptional response using genome-wide transcriptional modelling

Affiliations

Dissection of a complex transcriptional response using genome-wide transcriptional modelling

Martino Barenco et al. Mol Syst Biol. 2009.

Abstract

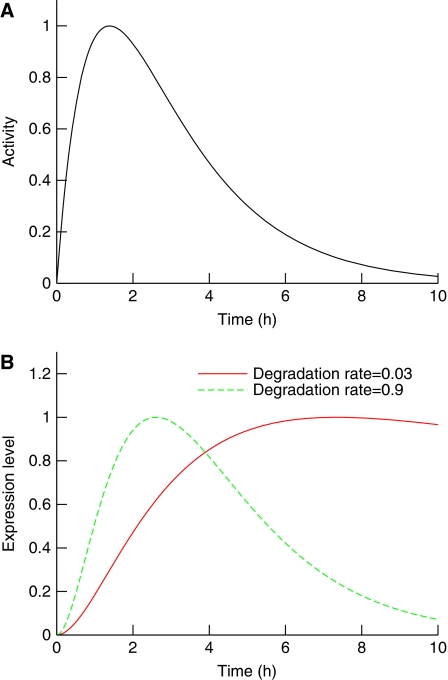
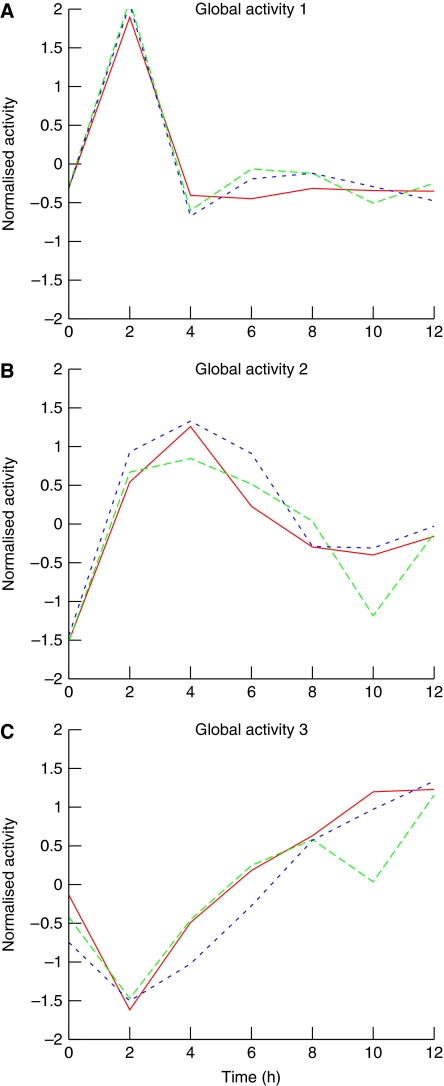
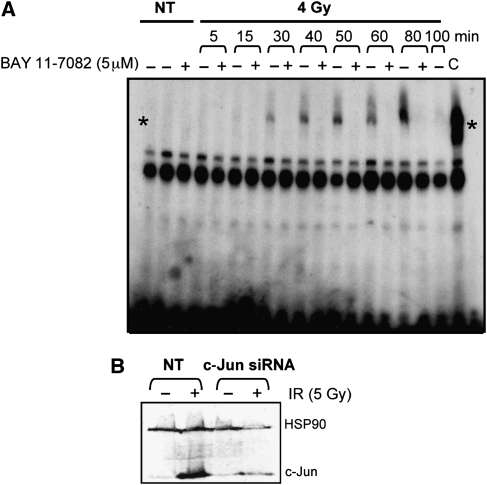
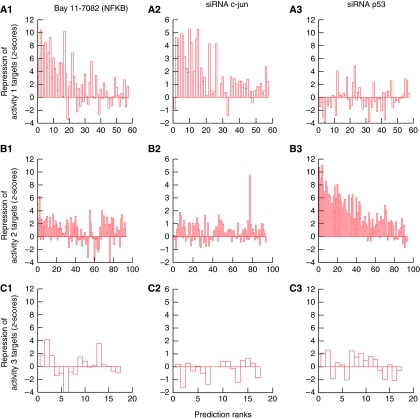
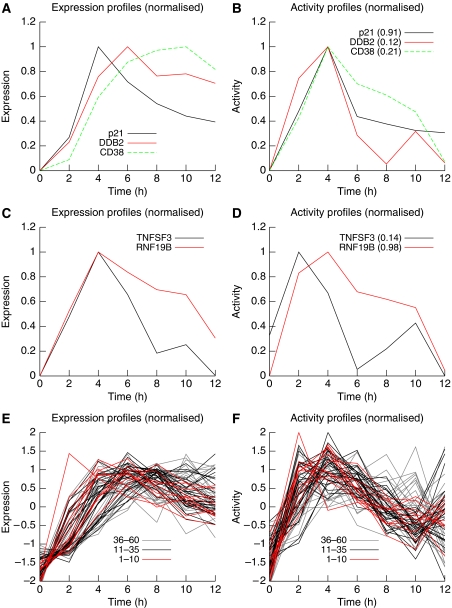
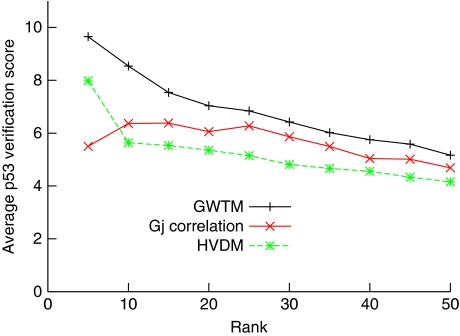
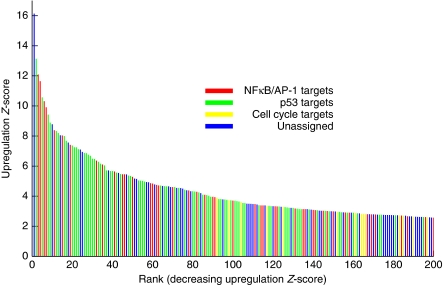
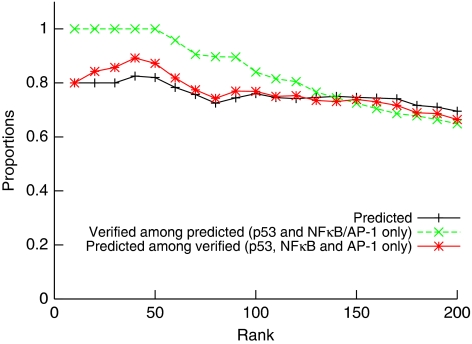
Modern genomics technologies generate huge data sets creating a demand for systems level, experimentally verified, analysis techniques. We examined the transcriptional response to DNA damage in a human T cell line (MOLT4) using microarrays. By measuring both mRNA accumulation and degradation over a short time course, we were able to construct a mechanistic model of the transcriptional response. The model predicted three dominant transcriptional activity profiles-an early response controlled by NFkappaB and c-Jun, a delayed response controlled by p53, and a late response related to cell cycle re-entry. The method also identified, with defined confidence limits, the transcriptional targets associated with each activity. Experimental inhibition of NFkappaB, c-Jun and p53 confirmed that target predictions were accurate. Model predictions directly explained 70% of the 200 most significantly upregulated genes in the DNA-damage response. Genome-wide transcriptional modelling (GWTM) requires no prior knowledge of either transcription factors or their targets. GWTM is an economical and effective method for identifying the main transcriptional activators in a complex response and confidently predicting their targets.


Conflict of interest statement

The authors declare that they have no conflict of interest.

Figures

Figure 1
Figure 1
Transcript degradation rates determine the shape of the response. (A) The activity profile of a hypothetical transcription factor. (B) The corresponding normalized responses of two target genes with different degradation rates. At a higher degradation rate, the initial response and the subsequent decay are swifter, and the transcript profile corresponds better to the driving activity. In contrast, with a smaller degradation rate, the transcript response profile is delayed and peaks later.
Figure 2
Figure 2
The three main activities in the DNA-damage response network. Individual activity profiles of the constituents of the merged cliques were normalized to an average of zero and an s.d. value of one. Global activity profiles were obtained by averaging these normalized profiles. Within each panel, individual curves represent a different replicate. (A) Global activity 1 corresponds to the activity of both NF-κB and c-Jun/AP-1, and has a rapid onset and decline. (B) Global activity 2 corresponds to the activity of p53, a transcription factor that is pivotal in the DNA-damage response network. (C) Global activity 3 likely corresponds to the transcription of genes in cells re-entering the cell cycle.
Figure 3
Figure 3
Experimental inhibition of transcription factors identified by GWTM. (A) Electrophoretic mobility shift assay showing precipitation of DNA bound NF-κB (*) after irradiation (4 Gy; NT, not treated) in the presence (+) or absence (−) of the specific NF-κB inhibitor BAY 11-7082 (C, control). (B) Western blot showing levels of c-Jun before and after irradiation (5 Gy) in the presence or absence of transfected siRNAc-Jun. (NT, not treated; HSP90, loading control).
Figure 4
Figure 4
Experimental verification of GWTM predictions. MOLT4 cells were irradiated in the presence of specific inhibitors of the three transcription factors identified as regulating the two major activities predicted by GWTM. Values on the y axis are Z scores representing the degree to which transcription of a target is reduced as a result of addition of the given inhibitor. Rank of GWTM prediction for each activity is represented on the x axis. (A: 1–3) Global activity 1 is inhibited principally by the NF-κB inhibitor, BAY 11-7082, but also to a slightly lesser degree by siRNAc-Jun. (B: 1–3) Global activity 2 is inhibited only by siRNAp53. (C: 1–3) Global activity 3 is unaffected by specific inhibitors of NF-κB, c-Jun or p53. The decreasing Z-scores with rank indicate the accuracy of model predictions and their ranking.
Figure 5
Figure 5
Expression profiles and individual activity profiles for selected genes. (A) The normalized expression profiles of three verified p53 targets. Transcripts with a slower turnover rate (DDB2 and CD38) accumulate slowly and peak later than other genes (p21) for which degradation rate is higher. (B) Subtracting the degradation component reveals the production component. The individual activity profiles are similar because the three genes under review are activated by the same transcription factor, p53. (C) Despite having different activators (NF-κB and p53, respectively), genes TNFSF3 and RNF19B exhibit similar expression profiles. (D) TNFSF3 expression results from the combination of a fast onset activation (controlled by NF-κB) with a relatively ‘slow' degradation component. In contrast, RNFB19B is activated by a ‘slower' transcription factor (p53) but tends to track its movement more closely because of a relatively high transcript turnover rate. (E, F) are the same as (A, B), respectively, but include more predicted p53 targets, the top 60 (A, B represent the top three predictions). Contrasting the profiles shown in (E, F) helps creating a more coherent image. Ranking of the genes in the prediction list has been colour-coded and shows that lower ranked genes exhibit a more noisy profile, calling for a principled way to attribute genes individually to global activities.
Figure 6
Figure 6
Comparison of various methods for predicting p53 targets. Each curve represents the average p53 validation score up to the rank indicated on the horizontal axis. +/black, GWTM; */green, HVDM; x/red, using correlation of individual Gj profiles with the p53 global activity profile ranked by descending correlation coefficient.
Figure 7
Figure 7
GWTM predicts a large majority of the upregulated transcripts. A Z-score representing degree of DNA damage-induced upregulation was computed for each differentially expressed gene. GWTM-predicted targets of each of the three principal activities are highlighted (red, NF-κB- or c-Jun/AP-1-predicted targets; green, p53-predicted targets; yellow, cell cycle-predicted targets). The blue coloured bars correspond to genes that were not predicted to be direct targets of any of the three activities. Some of those may be co-regulated targets of more than one activity. For example, the most highly regulated gene, IER3, is a target of both NF-κB and p53.
Figure 8
Figure 8
Cumulative accuracy of GWTM. +/Black curve: cumulative fraction of the upregulated genes that are predicted by GWTM to be targets of one of the three main activities. Green: proportion of GWTM predicted genes that were verified by experimental knockdown of transcription factor (p53 and NF-κB /c-Jun only). Red: proportion of genes verified by experimental knockdown of transcription factor (only p53 and NF-κB or c-Jun/AP-1) that were also predicted by GWTM.

Similar articles

Cited by

References

    1. Abe Y, Takeuchi T, Kagawa-Miki L, Ueda N, Shigemoto K, Yasukawa M, Kito K (2007) A mitotic kinase TOPK enhances Cdk1/cyclin B1-dependent phosphorylation of PRC1 and promotes cytokinesis. J Mol Biol 370: 231–245 - PubMed
    1. Backes C, Keller A, Kuentzer J, Kneissl B, Comtesse N, Elnakady YA, Muller R, Meese E, Lenhof HP (2007) GeneTrail—advanced gene set enrichment analysis. Nucleic Acids Res 35: W186–W192 - PMC - PubMed
    1. Barenco M, Papouli E, Shah S, Brewer D, Miller CJ, Hubank M (2009) rHVDM: an R package to predict the activity and targets of a transcription factor. Bioinformatics 25: 419–420 - PubMed
    1. Barenco M, Tomescu D, Brewer D, Callard R, Stark J, Hubank M (2006) Ranked prediction of p53 targets using hidden variable dynamic modeling. Genome Biol 7: R25. - PMC - PubMed
    1. Bates S, Rowan S, Vousden KH (1996) Characterisation of human cyclin G1 and G2: DNA damage inducible genes. Oncogene 13: 1103–1109 - PubMed

Publication types

MeSH terms