. 2009;124(2):597-636.
doi: 10.1162/qjec.2009.124.2.597.

DOES MEDICARE SAVE LIVES?

Affiliations

DOES MEDICARE SAVE LIVES?

David Card et al. Q J Econ. 2009.

Abstract

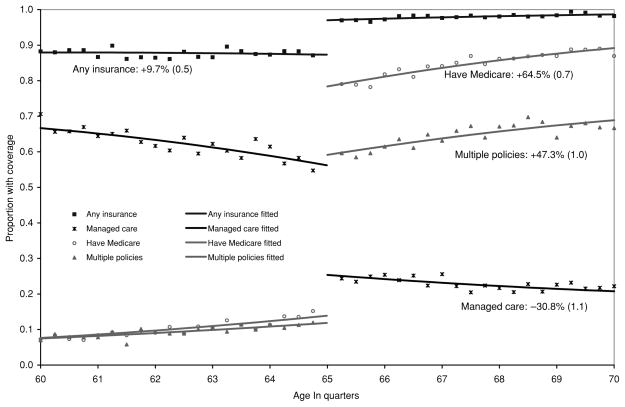
Health insurance characteristics shift at age 65 as most people become eligible for Medicare. We measure the impacts of these changes on patients who are admitted to hospitals through emergency departments for conditions with similar admission rates on weekdays and weekends. The age profiles of admissions and comorbidities for these patients are smooth at age 65, suggesting that the severity of illness is similar on either side of the Medicare threshold. In contrast, the number of procedures performed in hospitals and total list charges exhibit small but statistically significant discontinuities, implying that patients over 65 receive more services. We estimate a nearly 1-percentage-point drop in 7-day mortality for patients at age 65, equivalent to a 20% reduction in deaths for this severely ill patient group. The mortality gap persists for at least 9 months after admission.


Figures

Figure I
Figure I. Changes in Health Insurance at Age 65 in National Health Interview Survey
Samples are based on data from the National Health Interview Survey, 1999–2003. The estimated discontinuities (and standard errors) at age 65 and the fitted lines are from a regression with a quadratic polynomial in age fully interacted with a dummy for age greater than or equal to 65. Models also include a dummy for people assigned to age 65.0 whose Medicare eligibility status is uncertain. Points represent means for people in each age cell (measured in quarters). Points for peope age 65.0 are not shown in the figure. Estimated fraction who have Medicare includes all forms of Medicare coverage—see text for discussion of underreporting of Medicare coverage in NHIS. Estimated fraction with multiple policies includes people with at least two forms of health insurance coverage (e.g., Medicare and private supplemental coverage, or Medicare and Medicaid).
Figure II
Figure II. Number of Admissions by Route into Hospital, California, 1992–2002
The lines are fitted values from regressions that include a second-order polynomial in age fully interacted with a dummy for age ≧65 and a dummy variable for the month before people turn 65. The dependent variable is the log of the number of admissions by patient’s age (in days) at admission, for patients between 60 and 70 years of age. The count of admissions is based on hospital discharge records for California and includes admissions from January 1, 1992, to November 30, 2002. The points represent means of the dependent variable for 30-day cells. The age profile for unplanned ED admissions includes admissions that occurred through the emergency department and were unplanned. The category “Other Admissions” includes all other admissions.
Figure III
Figure III. Admissions through the ED by Quartile of t-test for Equality of Weekend and Weekday Admission Rates
See notes for Figure II. In this figure the population of patients with an unplanned admission through the ED is split into four groups based on the primary diagnosis ICD-9 code. Groups are defined by the range of the t-statistic for the test that 2/7 of admissions with the diagnosis occur on the weekend. The y-axis is the log of the number of admissions in the group by patient’s age (in days) at admission, for patients between 60 and 70 years of age. The count of admissions is based on hospital discharge records for California and includes admissions from January 1, 1992, to November 30, 2002.
Figure IV
Figure IV. Primary Insurance Coverage of Admitted Patients
See notes for Figure II. In this figure the y-axis represents the fraction of patients with different classes of primary insurance coverage. Sample includes 425,315 patients with nondeferrable primary diagnoses, defined as unplanned admissions through the emergency department for diagnoses with a t-statistic for the test of equal weekday and weekend admission rates of 0.965 or less. Medicare eligibility status of patients within one month of their 65th birthdays is uncertain and we have excluded these observations.
Figure V
Figure V. Three Measures of Inpatient Treatment Intensity
See notes to Figure IV. Sample includes unplanned admissions through the emergency department for diagnoses with a t-statistic for the test of equal weekday and weekend admission rates of 0.965 or less. In this figure the sample is further restricted to patients with valid SSNs (407,386 observations). Sample for log list charges excludes patients admitted to Kaiser hospitals. Length of stay, number of procedures, and list charges are cumulated over all consecutive hospitalizations. List charges are measured in 2002 dollars.
Figure VI
Figure VI. Patient Mortality Rates over Different Follow-Up Intervals
See notes to Figure IV. Sample includes unplanned admissions through the emergency department for diagnoses with a t-statistic for the test of equal weekday and weekend admission rates of 0.965 or less. In this figure the sample is further restricted to patients with valid SSNs (407,386 observations). Deaths include include in-hospital and out-of-hospital deaths.
Figure VII
Figure VII. Estimates of the Discontinuity in Mortality Rates at Age 65 over Various Follow-Up Periods
See notes to Figure VI. The estimates in this figure are from a regression with a quadratic polynomial in age fully interacted with a dummy for age over 65. The regressions also include a dummy for patients within one month of their 65th birthdays, month and year dummies, fixed effects for the primary diagnosis, and dummies for race, sex, and admissions on Saturday or Sunday. Regression discontinuities are estimated for probability of death within 7, 14, and 28 days and then at 30-day intervals. The estimates and associated 95% confidence intervals from each regression are then linearly interpolated in the figure.

References

    1. Autor David H, Duggan Mark G. The Rise in the Disability Rolls and the Decline in Unemployment. Quarterly Journal of Economics. 2003;118:157–205.
    1. Canto John G, Rogers William J, Chandra Nisha C, French William J, Barron Hal V, Frederick Paul D, Maynard Charles, Every Nathan R. The Association of Sex and Payer Status on Management and Subsequent Survival in Acute Myocardial Infarction. Archives of Internal Medicine. 2000;162:587–593. - PubMed
    1. Card David, Dobkin Carlos, Maestas Nicole. The Impact of Nearly Universal Insurance Coverage on Health Care Utilization and Health: Evidence from Medicare. 2004 NBER Working Paper No. 10365. - PMC - PubMed
    1. Card David, Dobkin Carlos, Maestas Nicole. The Impact of Nearly Universal Insurance Coverage on Health Care Utilization: Evidence from Medicare. American Economic Review. 2008;98:2242–2258. - PMC - PubMed
    1. Cohen Robin A, Martinez Michael E. Impact of Medicare and Medicaid Probe Questions on Health Insurance Estimates in the National Health Interview Survey, 2005. Report, Centers for Disease Control, National Center for Health Statistics. 2007 May;