

A calibration method for nanowire biosensors to suppress device-to-device variation
- PMID: 19921812
- PMCID: PMC2805439
- DOI: 10.1021/nn9011384
A calibration method for nanowire biosensors to suppress device-to-device variation
Abstract
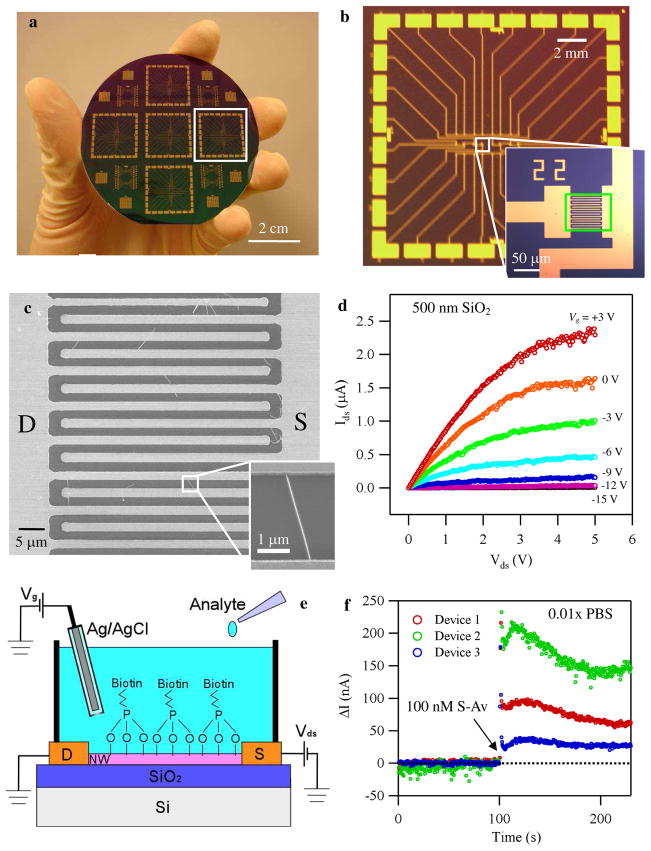
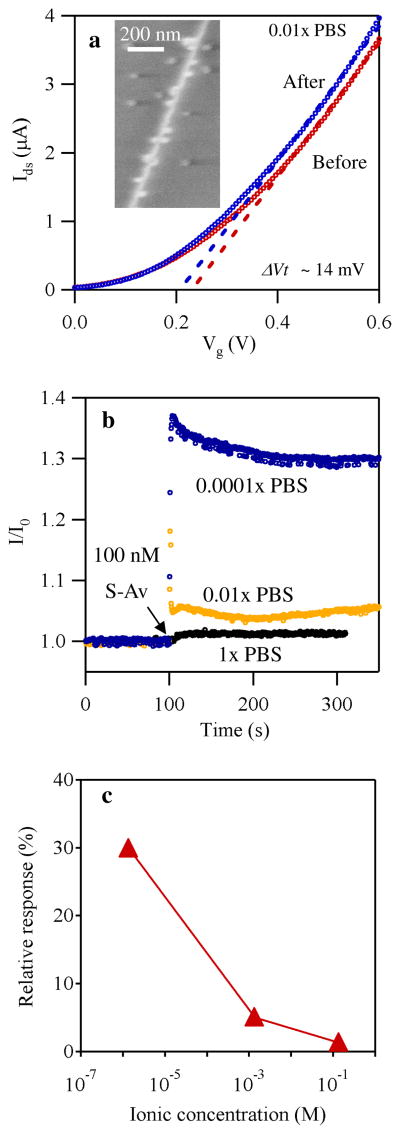
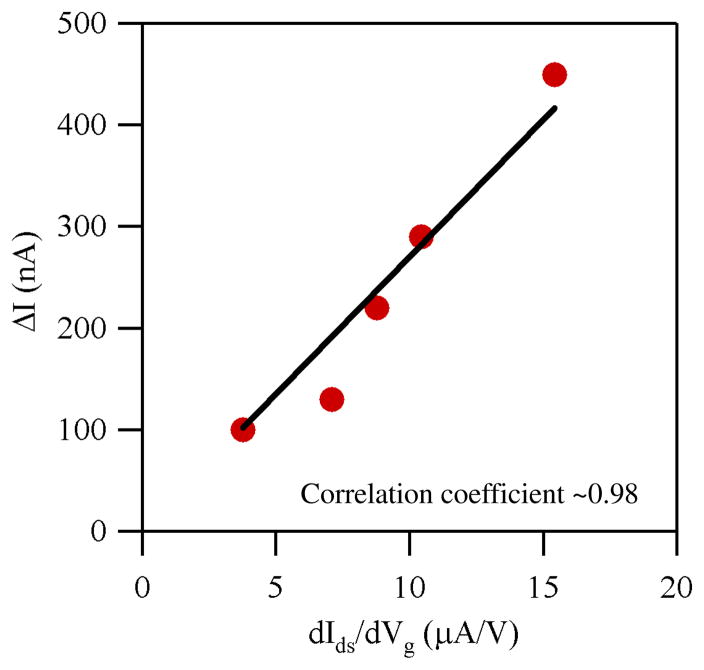
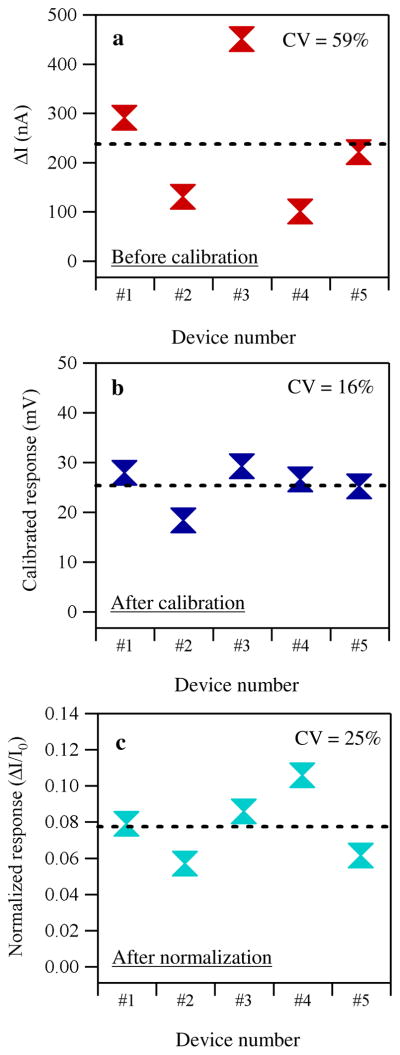
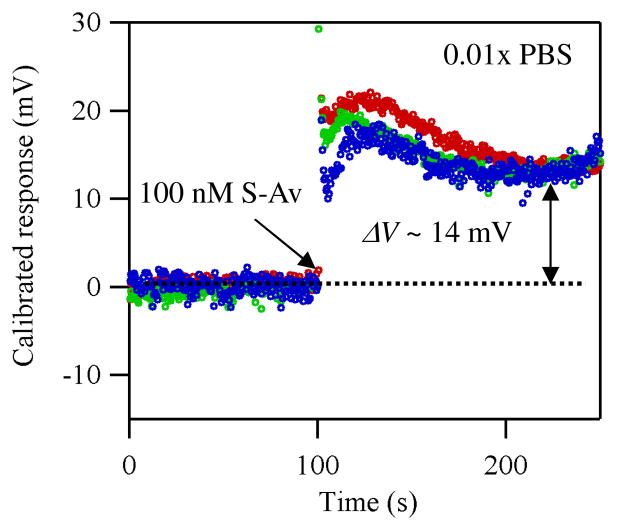
Nanowire/nanotube biosensors have stimulated significant interest; however, the inevitable device-to-device variation in the biosensor performance remains a great challenge. We have developed an analytical method to calibrate nanowire biosensor responses that can suppress the device-to-device variation in sensing response significantly. The method is based on our discovery of a strong correlation between the biosensor gate dependence (dI(ds)/dV(g)) and the absolute response (absolute change in current, DeltaI). In(2)O(3) nanowire-based biosensors for streptavidin detection were used as the model system. Studying the liquid gate effect and ionic concentration dependence of strepavidin sensing indicates that electrostatic interaction is the dominant mechanism for sensing response. Based on this sensing mechanism and transistor physics, a linear correlation between the absolute sensor response (DeltaI) and the gate dependence (dI(ds)/dV(g)) is predicted and confirmed experimentally. Using this correlation, a calibration method was developed where the absolute response is divided by dI(ds)/dV(g) for each device, and the calibrated responses from different devices behaved almost identically. Compared to the common normalization method (normalization of the conductance/resistance/current by the initial value), this calibration method was proven advantageous using a conventional transistor model. The method presented here substantially suppresses device-to-device variation, allowing the use of nanosensors in large arrays.
Figures
Similar articles
-
Identifying the mechanism of biosensing with carbon nanotube transistors.Nano Lett. 2008 Feb;8(2):591-5. doi: 10.1021/nl072996i. Epub 2007 Dec 28. Nano Lett. 2008. PMID: 18162002
-
Quantitative measurements of C-reactive protein using silicon nanowire arrays.Int J Nanomedicine. 2008;3(1):117-24. doi: 10.2147/ijn.s2437. Int J Nanomedicine. 2008. PMID: 18488422 Free PMC article.
-
Novel poly-silicon nanowire field effect transistor for biosensing application.Biosens Bioelectron. 2009 Jan 1;24(5):1223-9. doi: 10.1016/j.bios.2008.07.032. Epub 2008 Jul 26. Biosens Bioelectron. 2009. PMID: 18760914
-
Biodiagnostics using oriented and aligned inorganic semiconductor nanotubes and nanowires.J Nanosci Nanotechnol. 2013 Jul;13(7):4473-96. doi: 10.1166/jnn.2013.7771. J Nanosci Nanotechnol. 2013. PMID: 23901469 Review.
-
Silicon nanowire field-effect-transistor based biosensors: from sensitive to ultra-sensitive.Biosens Bioelectron. 2014 Oct 15;60:101-11. doi: 10.1016/j.bios.2014.03.057. Epub 2014 Apr 15. Biosens Bioelectron. 2014. PMID: 24787124 Review.
Cited by
-
Capacitance-modulated transistor detects odorant binding protein chiral interactions.Nat Commun. 2015 Jan 16;6:6010. doi: 10.1038/ncomms7010. Nat Commun. 2015. PMID: 25591754 Free PMC article.
-
Molecular analysis of blood with micro-/nanoscale field-effect-transistor biosensors.Small. 2011 Jul 18;7(14):1863-75. doi: 10.1002/smll.201100211. Epub 2011 Jun 3. Small. 2011. PMID: 21638783 Free PMC article. Review.
-
Addressing Signal Drift and Screening for Detection of Biomarkers with Carbon Nanotube Transistors.ACS Nano. 2024 Feb 9:10.1021/acsnano.3c11679. doi: 10.1021/acsnano.3c11679. Online ahead of print. ACS Nano. 2024. PMID: 38335120 Free PMC article.
-
Strategies for enhancing the analytical performance of nanomaterial-based sensors.Trends Analyt Chem. 2013 Jun;47:27-36. doi: 10.1016/j.trac.2013.02.004. Epub 2013 Mar 16. Trends Analyt Chem. 2013. PMID: 32287538 Free PMC article. Review.
-
Selective, electrochemically activated biofunctionalization of In2O3 nanowires using an air-stable surface modifier.ACS Appl Mater Interfaces. 2011 Dec;3(12):4765-9. doi: 10.1021/am2012454. Epub 2011 Nov 11. ACS Appl Mater Interfaces. 2011. PMID: 22039782 Free PMC article.
References
-
- Cui Y, Wei QQ, Park HK, Lieber CM. Nanowire Nanosensors for Highly Sensitive and Selective Detection of Biological and Chemical Species. Science. 2001;293:1289–1292. - PubMed
-
- Star A, Gabriel JCP, Bradley K, Gruner G. Electronic Detection of Specific Protein Binding Using Nanotube FET Devices. Nano Lett. 2003;3:459–463.
-
- Li C, Curreli M, Lin H, Lei B, Ishikawa FN, Datar R, Cote RJ, Thompson ME, Zhou CW. Complementary Detection of Prostate-Specific Antigen Using In2O3 Nanowires and Carbon Nanotubes. J Am Chem Soc. 2005;127:12484–12485. - PubMed
Publication types
MeSH terms
Grants and funding
LinkOut - more resources
Full Text Sources
Other Literature Sources
