. 2010 Feb 5;9(2):761-76.
doi: 10.1021/pr9006365.

Repeatability and reproducibility in proteomic identifications by liquid chromatography-tandem mass spectrometry

Affiliations

Repeatability and reproducibility in proteomic identifications by liquid chromatography-tandem mass spectrometry

David L Tabb et al. J Proteome Res. .

Abstract

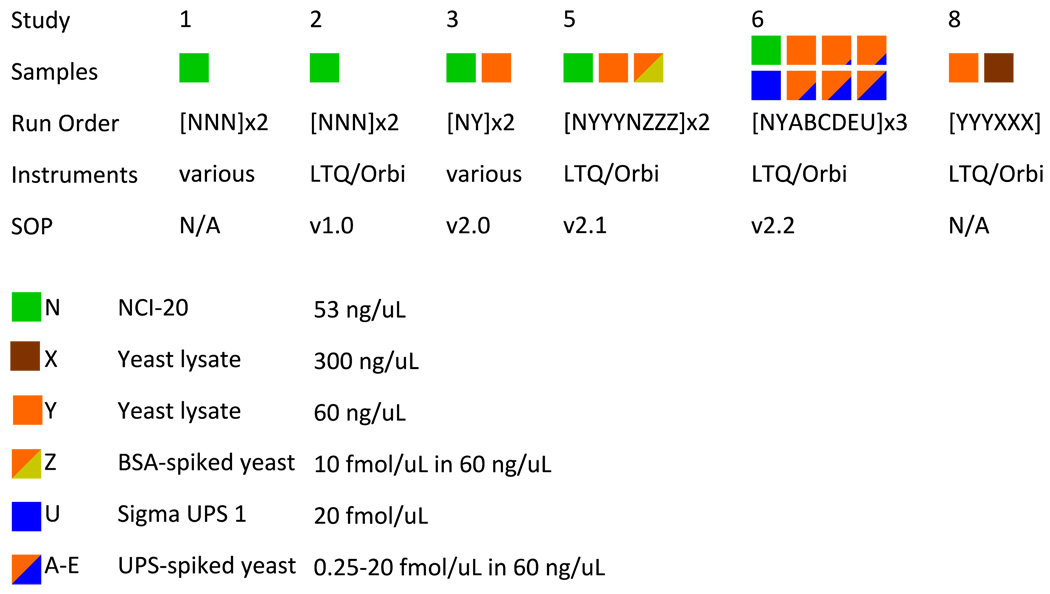
The complexity of proteomic instrumentation for LC-MS/MS introduces many possible sources of variability. Data-dependent sampling of peptides constitutes a stochastic element at the heart of discovery proteomics. Although this variation impacts the identification of peptides, proteomic identifications are far from completely random. In this study, we analyzed interlaboratory data sets from the NCI Clinical Proteomic Technology Assessment for Cancer to examine repeatability and reproducibility in peptide and protein identifications. Included data spanned 144 LC-MS/MS experiments on four Thermo LTQ and four Orbitrap instruments. Samples included yeast lysate, the NCI-20 defined dynamic range protein mix, and the Sigma UPS 1 defined equimolar protein mix. Some of our findings reinforced conventional wisdom, such as repeatability and reproducibility being higher for proteins than for peptides. Most lessons from the data, however, were more subtle. Orbitraps proved capable of higher repeatability and reproducibility, but aberrant performance occasionally erased these gains. Even the simplest protein digestions yielded more peptide ions than LC-MS/MS could identify during a single experiment. We observed that peptide lists from pairs of technical replicates overlapped by 35-60%, giving a range for peptide-level repeatability in these experiments. Sample complexity did not appear to affect peptide identification repeatability, even as numbers of identified spectra changed by an order of magnitude. Statistical analysis of protein spectral counts revealed greater stability across technical replicates for Orbitraps, making them superior to LTQ instruments for biomarker candidate discovery. The most repeatable peptides were those corresponding to conventional tryptic cleavage sites, those that produced intense MS signals, and those that resulted from proteins generating many distinct peptides. Reproducibility among different instruments of the same type lagged behind repeatability of technical replicates on a single instrument by several percent. These findings reinforce the importance of evaluating repeatability as a fundamental characteristic of analytical technologies.


Figures

Figure 1
Figure 1. Overview of CPTAC Unbiased Discovery Working Group interlaboratory studies
All studies employed the NCI-20 reference mixture. Beginning with Study 3, a yeast lysate reference sample was introduced. Studies 2, 3, and 5 revealed ambiguities in the SOP that were corrected in subsequent versions. Studies 2–8 all prescribed blanks and washes between samples. Study 8 returned to lab-specific protocols in examining two different yeast concentrations. The full details of the SOP versions are available in Supplementary Information.
Figure 2
Figure 2. Bioinformatic variability in Orbitrap data for Study 6 Yeast
We evaluated the impact of bioinformatic changes in evaluating Orbitrap spectra for yeast in Study 6. Panel A evaluates the best precursor tolerance for database search in m/z space. Each instrument is represented by a different shape (see legend on Figure 3), with the number of identifications normalized to the highest value produced for that instrument. Too low a tolerance prevents correct sequences from being compared to some spectra, while too high a tolerance results in excessive comparisons for each spectrum. Panel B reveals that the peaks counts from tandem mass spectra were repeatable for a given instrument but varied considerably among instruments. Panel C shows that database searches that allow for a one neutron variance from reported precursor m/z improved peptide identification in all but one of the twelve replicates. Panel D demonstrates that substituting a different search engine (X!Tandem, in this case) will dramatically change which sequences are identified, even if the total number of identified spectra is essentially the same.
Figure 3
Figure 3. Overview of identified spectra in yeast replicates
formula image LTQ@73 formula image LTQx@65 formula image LTQ2@95 formula image LTQc@65 formula image Orbi@86 formula image OrbiO@65 formula image OrbiP@65 formula image 
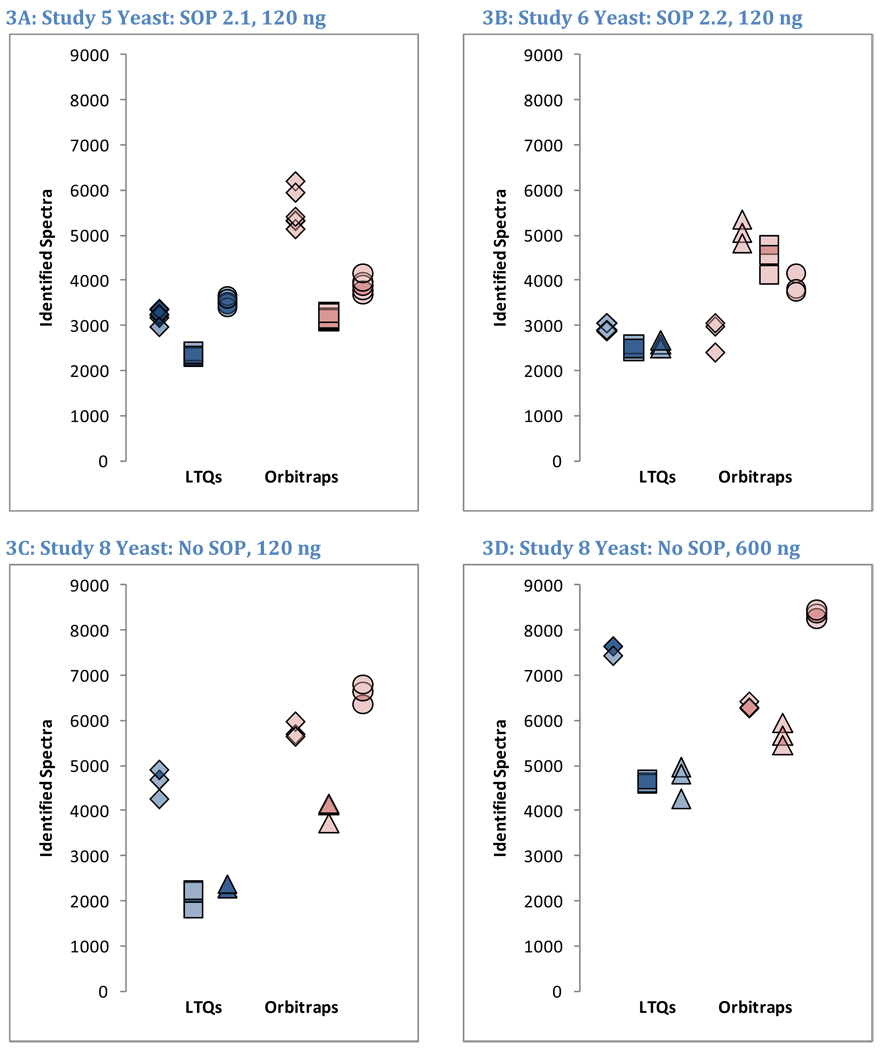
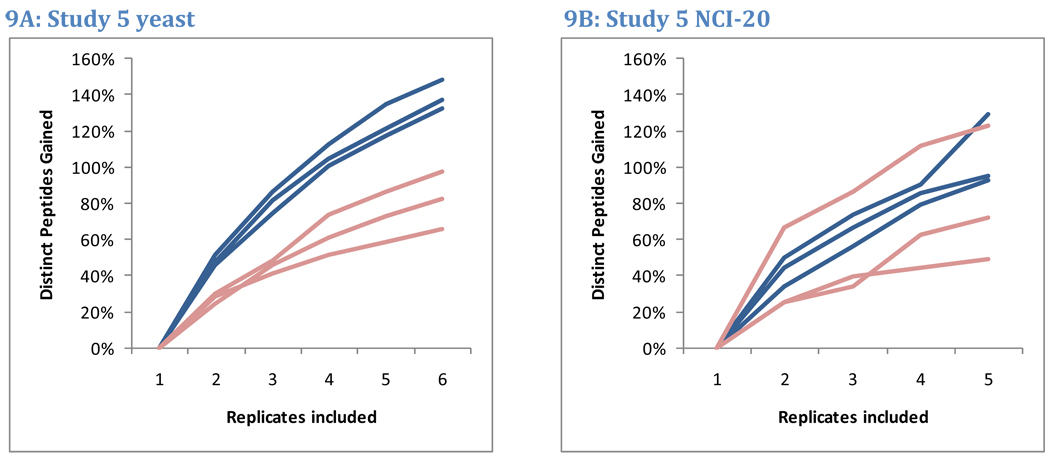
OrbiW@56 The number of spectra matched to peptide sequences varied considerably from instrument to instrument. These four graphs show the identification success for each yeast replicate in each instrument for Studies 5, 6, and 8 (two concentrations). LTQs are colored blue, and Orbitraps are shown in pink. A different shape represents each instrument appearing in the studies, as described in the legend. Each symbol reports identifications from an individual technical replicate. Despite SOP controls in Studies 5 and 6, instruments differed from each other by large margins. The Orbitrap at site 86 delivered the highest performance in Study 5, but performance decreased using the higher flow rate specified by the SOP in Study 6. Increasing the yeast concentration by five-fold in Study 8 increased the numbers of spectra identified.
Figure 4
Figure 4. Peptide and protein repeatability
To assess repeatability, we evaluated the overlapping fraction of identified peptides in pairs of technical replicates. For example, if 2523 and 2663 peptides were identified in two different replicates and 1362 of those sequences were common to both lists, the overlap between these replicates was 35.6%. Shaded boxes represent peptide repeatability, and open boxes represent protein repeatability (where two distinct peptide sequences were required for protein to be detected). For Study 5, only peptide repeatability was characterized; the boxes represent the inter-quartile range, while the whiskers represent the full range of observed values (Panels A and B). The mid-line in each box is the median. The six replicates of yeast in Study 5 enabled fifteen pair-wise comparisons per instrument, while the five replicates of NCI-20 enabled ten comparisons for that sample. Studies 6 (Panels C and D) and 8 (Panels E and F) produced triplicates, enabling only three pair-wise comparisons for repeatability. These images show all three values.
Figure 5
Figure 5. Peptide tryptic specificity impacts repeatability
Enzymatic digestion by trypsin favors the production of peptides that conform to standard cleavages after Lys or Arg on both termini. Fully tryptic peptides feature such cleavages on both termini, while semi-tryptic peptides match this cleavage motif on only one terminus. As shown in panel A, an average of 29% of fully tryptic yeast peptides appeared in all three replicates from Study 6. Semi-tryptic peptides were detected with lower probability. On average, only 15% of these peptides appeared in all three replicates. Though a higher percentage of semi-tryptic peptides were observed in Sigma UPS 1 (panels C and D), the repeatability for semi-tryptic peptides was lower than for tryptic sequences.
Figure 6
Figure 6. Precursor ion intensity affects peptide repeatability
We examined the MS ion intensity of peptides from the Study 5 NCI-20 quintuplicates in three LTQ and three Orbitrap instruments. When a peptide was observed in multiple replicates, we recorded the median intensity observed. These graphs depict the distribution of intensities for peptides by the number of replicates in which they were identified. Peptides that were observed in only one replicate were considerably less intense than those appearing in multiple replicates. Orbitrap and LTQ instruments report intensities on different scales as reflected by the x-axes of the graphs.
Figure 7
Figure 7. Protein of origin impacts repeatability
Peptide identifications from major proteins are more repeatable than those from minor proteins. Yeast data from Study 5, however, reveal that peptides from major proteins (here defined as those producing more than 32 peptides in the data accumulated for all instruments) constitute 40% of the peptides observed in all six replicates and 18% of the peptides observed in only one replicate. Peptides that are the sole evidence for a protein constitute 0% of the peptides observed in all six replicates but 13% of the peptides observed only once. These trends illustrate that major proteins contribute peptides across the entire range of repeatability. Achieving optimal sensitivity requires the acceptance of less-repeated peptides; in this data set, single-observation peptides were more than twice as numerous as any other set.
Figure 8
Figure 8. Reproducibility of yeast identifications among instruments
In this analysis, the identifications from each replicate are compared to the identifications of replicates from other instruments of the same type in the same study to determine the overlap in identifications. For example “S6-LTQ” shows the overlaps between pairs of RAW files from LTQs in Study 6, where each pair was required to come from two different LTQs. Shaded boxes represent peptides, while white boxes represent proteins. Because the Orbitrap at site 86 yielded abnormally low reproducibility in Study 6, the comparisons including this instrument were separated from the other three Orbitraps in this Study.
Figure 9
Figure 9. Peptide accumulation with additional replicates
Because peptides are partially sampled in each LC-MS/MS analysis, repeated replicates can build peptide inventories. Data from Study 5 reveal that this growth is not limited to the complex yeast samples but is also observed in the simple NCI-20 mixture. Blue lines represent growth in LTQ peptide lists, while pink lines represent Orbitrap peptide lists. The second NCI-20 replicate for the Orbitrap at site 86 identified more peptides than any other, producing a substantial increase in peptides from the first to the second replicate.
Figure 10
Figure 10. Study 5 yeast protein spectral count stability
Spectral count differentiation attempts to detect differences between samples by recognizing changes in the numbers of spectra identified to those proteins. This image depicts the stability of spectral counts across six replicates when the sample is unchanged. A value of zero represents spectral counts that are spread across the replicates as evenly as possible. A value of 5 indicates that the ratio of probabilities for the observed spread of spectral counts versus the even distribution is e5=148. LTQs showed greater instability of spectral counts than did Orbitraps.

References

    1. Steen H, Mann M. The ABC's (and XYZ's) of peptide sequencing. Nat Rev Mol Cell Biol. 2004;5(9):699–711. - PubMed
    1. Prakash A, Mallick P, Whiteaker J, Zhang H, Paulovich A, Flory M, Lee H, Aebersold R, Schwikowski B. Signal maps for mass spectrometry-based comparative proteomics. Mol Cell Proteomics. 2006;5(3):423–432. - PubMed
    1. Liu H, Sadygov RG, Yates JR., 3rd A model for random sampling and estimation of relative protein abundance in shotgun proteomics. Anal Chem. 2004;76(14):4193–4201. - PubMed
    1. Tabb DL, MacCoss MJ, Wu CC, Anderson SD, Yates JR., 3rd Similarity among tandem mass spectra from proteomic experiments: detection, significance, and utility. Anal Chem. 2003;75(10):2470–2477. - PubMed
    1. de Godoy LM, Olsen JV, de Souza GA, Li G, Mortensen P, Mann M. Status of complete proteome analysis by mass spectrometry: SILAC labeled yeast as a model system. Genome Biol. 2006;7(6):R50. - PMC - PubMed

Publication types

MeSH terms

LinkOut - more resources